

2nd Look at Local Housing Markets in May
2nd Look at Local Housing Markets in May

NOTE: The tables for active listings, new listings and closed sales all include a comparison to May 2019 for each local market (some 2019 data is not available).
This is the second look at several early reporting local markets in May. I’m tracking over 40 local housing markets in the US. Some of the 40 markets are states, and some are metropolitan areas. I’ll update these tables throughout the month as additional data is released.
Closed sales in May were mostly for contracts signed in March and April when 30-year mortgage rates averaged 6.82% and 6.99%, respectively (Freddie Mac PMMS). This is down from the 7%+ mortgage rates in the August through November period (although rates are now back above 7% again).
Active Inventory in May
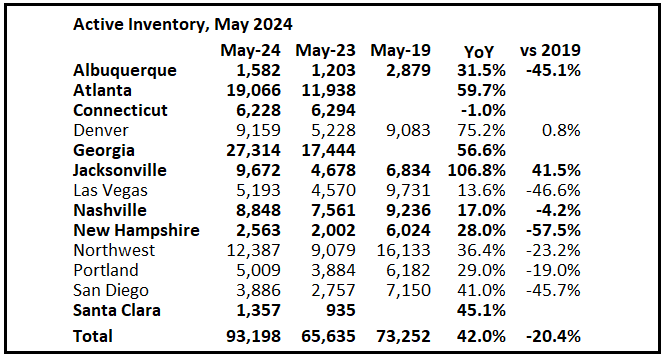
Here is a summary of active listings for these early reporting housing markets.
Inventory is up 42.0% year-over-year (YoY). Last month inventory in these markets was up 30.1% YoY. A key will be how much inventory builds over the next few months.
Inventory is down in most of these areas compared to 2019. Inventory in Jacksonville is up compared to May 2019.
Notes for all tables:
New additions to tables in BOLD.
Northwest (Seattle), Jacksonville Source: Northeast Florida Association of REALTORS®
Totals do not include Atlanta (included in state total)
Comparison to 2019 ONLY includes local markets with available 2019 data!
New Listings in May
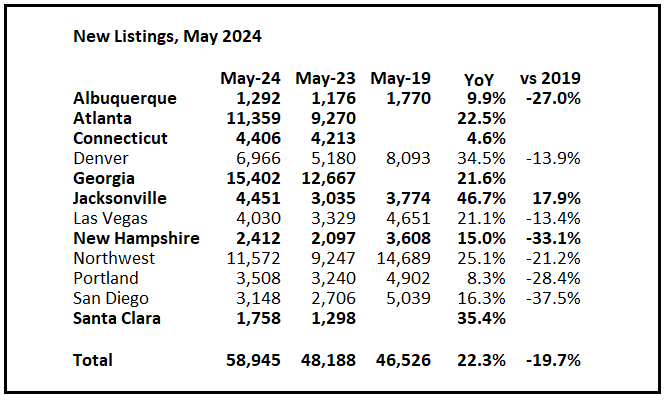
And here is a table for new listings in May (some areas don’t report new listings). For these areas, new listings were up 22.3% year-over-year.
Last month, new listings in these markets were up 28.6% year-over-year.
New listings are now up year-over-year, but still at historically low levels. New listings in all of these areas - except Jacksonville - are down compared to May 2019 activity.
Closed Sales in May
And a table of May sales.
In May, sales in these markets were up 1.5% YoY. Last month, in April, these same markets were up 7.9% year-over-year Not Seasonally Adjusted (NSA).
Sales in all of these markets are down compared to May 2019.
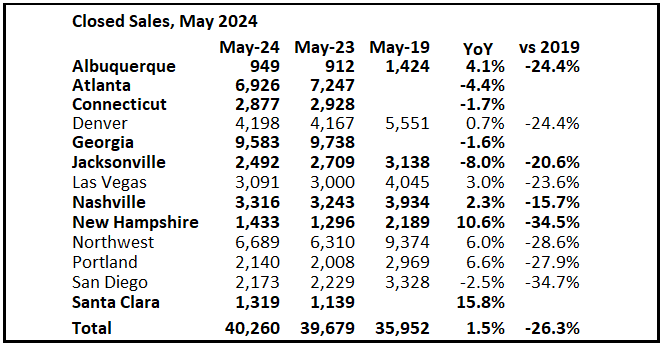
This is a small year-over-year increase NSA for these markets. There were the same number of working days in May 2024 compared to May 2023, so the year-over-year change in the seasonally adjusted sales will be about the same as the NSA data suggests.
This graph shows existing home sales by month for 2023 and 2024, on a Seasonally Adjusted Annual Rate (SAAR) basis. The NAR reported sales in May 2023 were 4.23 million SAAR.
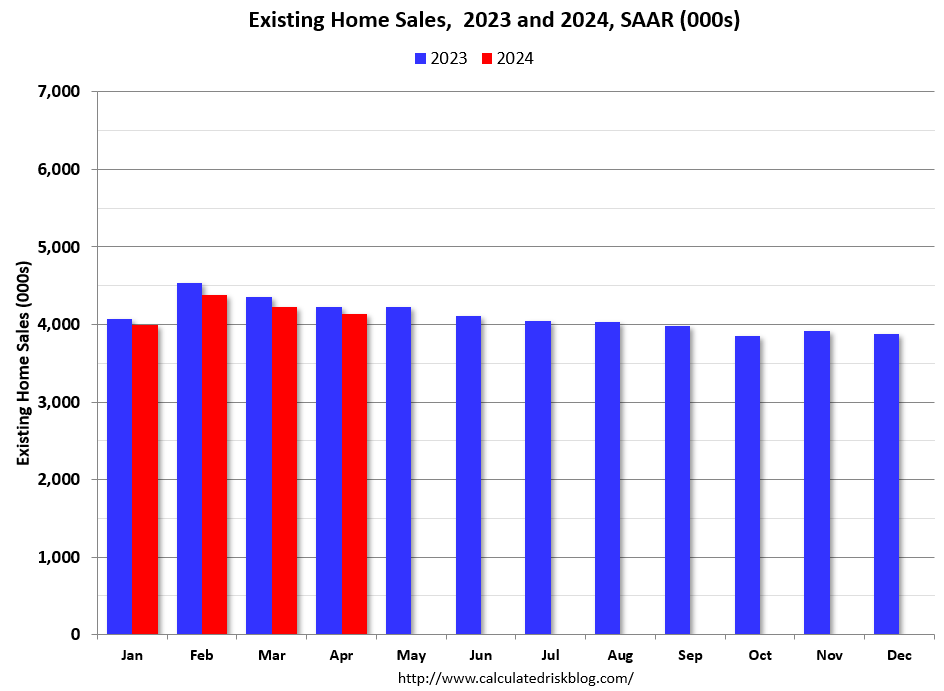
This early data suggests that the May existing home sales report will likely show sales close to sales in May 2023, and possibly a YoY increase from the May 2023 sales rate. If sales increased YoY in May, this will be the first YoY increase since August 2021, following 32 consecutive months with a YoY decline in sales.
Many more local markets to come!