


1st Look at Local Housing Markets in February
Early Reports Suggest Sales will be up from January

NOTE: The tables for active listings, new listings and closed sales all include a comparison to February 2019 for each local market (some 2019 data is not available).
This is the first look at several early reporting local markets in February. I’m tracking about 40 local housing markets in the US. Some of the 40 markets are states, and some are metropolitan areas. I’ll update these tables throughout the month as additional data is released.
Closed sales in February were mostly for contracts signed in December and January when 30-year mortgage rates averaged 6.82% and 6.64%, respectively. This is down from the 7%+ mortgage rates in the August through November period.
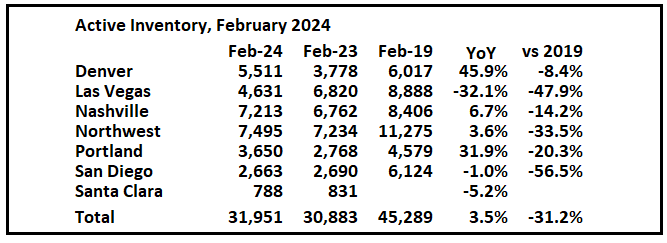
Active Inventory in February
Here is a summary of active listings for these early reporting housing markets in January.
Inventory for these markets were down 3.8% year-over-year in January and are now up 3.5% year-over-year. A key will be if inventory builds over the next few months.
Inventory is down in all of these areas compared to 2019.
Notes for all tables:
New additions to table in BOLD.

New Listings in February
Keep reading with a 7-day free trial
Subscribe to CalculatedRisk Newsletter to keep reading this post and get 7 days of free access to the full post archives.