

1st Look at Local Housing Markets in August
1st Look at Local Housing Markets in August
Early Reports Suggest Possible First YoY Sales Increase in 3 Years

NOTE: The tables for active listings, new listings and closed sales all include a comparison to August 2019 for each local market (some 2019 data is not available).
This is the first look at several early reporting local markets in August. I’m tracking over 40 local housing markets in the US. Some of the 40 markets are states, and some are metropolitan areas. I’ll update these tables throughout the month as additional data is released.
Closed sales in August were mostly for contracts signed in June and July when 30-year mortgage rates averaged 6.92% and 6.85%, respectively (Freddie Mac PMMS).
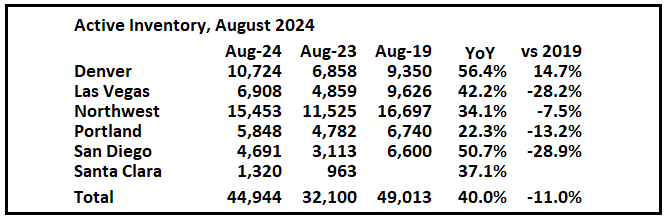
Active Inventory in August
Here is a summary of active listings for these early reporting housing markets.
Inventory was up 40.0% year-over-year. Last month inventory in these markets was up 44.6% YoY. A key for house prices will be the level of inventory later this year.
Inventory is down in most of these areas compared to 2019. Inventory in Denver and is now up compared to August 2019.
Notes for all tables:
New additions to table in BOLD.
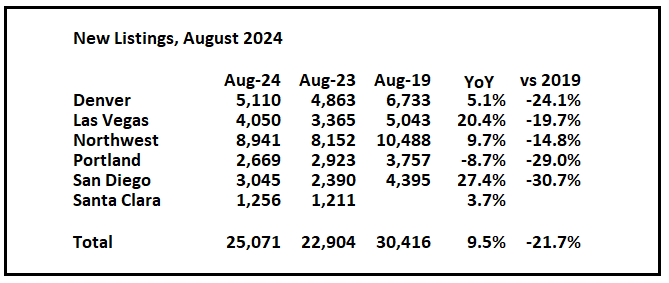
New Listings in August
And here is a table for new listings in August (some areas don’t report new listings). For these areas, new listings were up 9.5% year-over-year.
Last month, new listings in these markets were up 8.5% year-over-year.
New listings are now up year-over-year, but still at historically low levels. New listings in all of these areas are down compared to August 2019 activity.
Closed Sales in August
And a table of August sales.
CORRECTION: Sales in San Diego for August 2023 were incorrect (now corrected)
In August, sales in these markets were down 1.7% YoY. Last month, in July, these same markets were up 5.8% year-over-year Not Seasonally Adjusted (NSA).
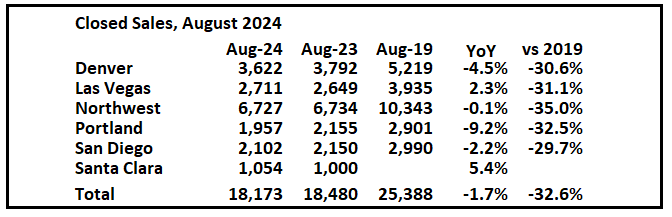
Important: There was one fewer working day in August 2024 compared to August 2023 (22 vs 23), so seasonally adjusted sales up be up more than NSA sales. Last month, in July 2024, there were two more working days compared to July 2023 (22 vs 20), so seasonally adjusted sales were lower than the NSA data suggests.
Sales in all of these markets are down significantly compared to July 2019.
This graph shows existing home sales by month for 2023 and 2024, on a Seasonally Adjusted Annual Rate (SAAR) basis. The NAR reported sales in August 2023 were 4.03 million SAAR.
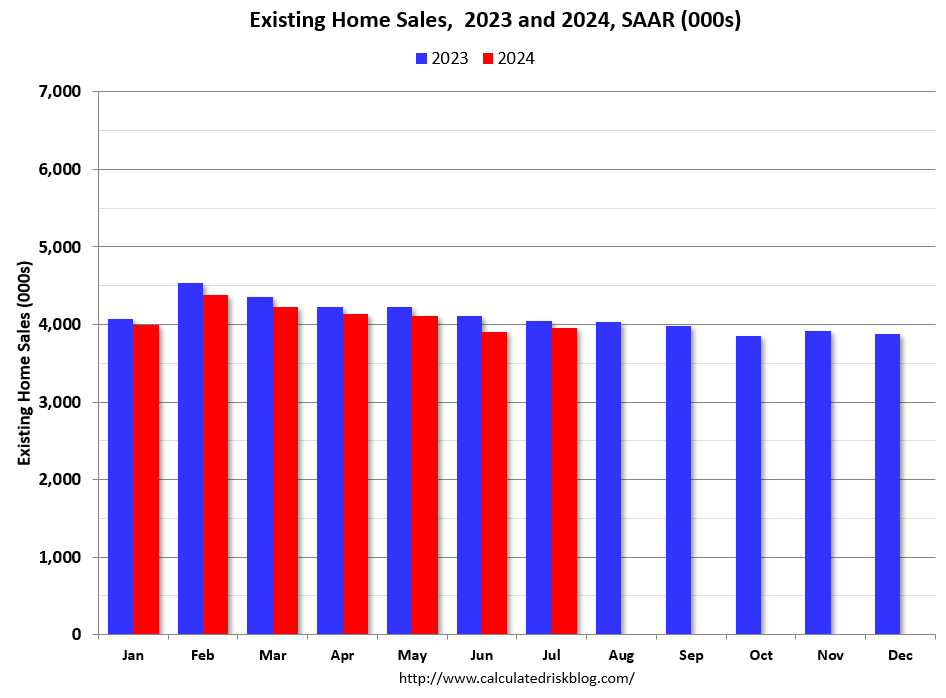
This early data suggests that the August existing home sales report might show the first year-over-year gain since August 2021. Of course, sales will still be historically low.
This was just a several early reporting markets. Many more local markets to come!