1st Look at Local Housing Markets in April
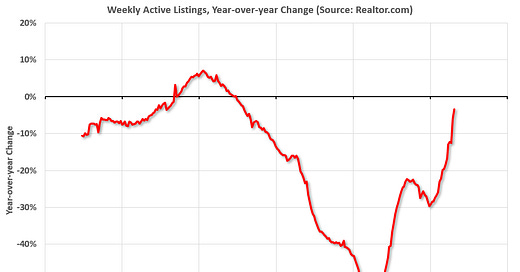
Realtor.com shows active inventory down only 3% year-over-year
This is the first look at local markets in April (I mentioned Denver earlier). I’m tracking about 35 local housing markets in the US. Some of the 35 markets are states, and some are metropolitan areas. I’ll update these tables throughout the month as additional data is released.
My view has been that the slowdown in the housing market would show up in inventory first. And we are seeing a significant change in inventory right now! (Likely due to higher mortgage rates)
The following data is important, especially active inventory. On a national basis, we saw record low inventory levels over the Winter. Last year, inventory didn’t bottom seasonally until early April. This year inventory bottomed in February (normal seasonal timing).
The next milestone will be when inventory is up year-over-year (YoY). My current guess is inventory will be up YoY before mid-year.
Housing Inventory Milestones to Watch
The seasonal bottom. ✅
Inventory up year-over-year
Inventory up compared to two years ago
Inventory back to median for last decade
So far #1 has happened, and #2 will probably happen before mid-year 2022.
Here is the weekly data from Realtor.com: Weekly Housing Trends View — Data Week Ending April 30, 2022. They have data on list prices, new listing and more, but this focus is on inventory.
• Active inventory is down just 3 percent from a year ago.
The number of homes for sale is past this year’s seasonal low, which was also a record low, which means the number of homes for sale is climbing week to week and month to month as it typically does in spring. While the market has not yet caught up to last year’s level, this week marked a sizeable step forward. The gap between this year’s homes for sale and last year’s is now just one-tenth the size that it was at the beginning of the year and half the size it was just last week.
Here is a graph of the year-over-year change in inventory according to realtor.com. Note: I corrected a sign error in the data for Feb 26, 2022.
The previous week, inventory was down 5.9% YoY according to Realtor.com. That was close to the 4.9% that Altos reported for the same week.
Denver, Las Vegas, Northwest, and San Diego
Here are a few local comments …
From Denver Metro Association of Realtors® (DMAR): DMAR Real Estate Market Trends Report
The increased interest rates are already impacting the amount of inventory sitting on the market. While Denver Metro is still relatively low in inventory, the word “historic” is no longer applicable as there were 610 fewer properties on the market last year compared to today. The market usually sees an 8.59 percent increase in month-over-month inventory. This month, it saw an outstanding 44.26 percent increase.
emphasis added
From Las Vegas Realtors® Local home prices keep climbing while sales start to slide
LVR housing statistics for April 2022
LVR President Brandon Roberts, a longtime local REALTOR®, said existing local home prices have now quadrupled since hitting their post-recession bottom in January of 2012, when the median single-family home price in Southern Nevada was $118,000.
“With mortgage interest rates going up in recent months and so few homes available for sale, it’s no wonder we’re selling fewer homes,” Roberts said. “Although local home prices are still increasing, we expect the rate of appreciation to start slowing down at some point as these trends continue. At least we had more homes available for sale than we had the previous month and the previous year.”
By the end of April, LVR reported 2,441 single-family homes listed for sale without any sort of offer. That’s up 33.6% from the same time last year. However, the 508 condos and townhomes listed without offers in April represent a 2.1% decrease from one year earlier.
From the Northwest MLS: Improving housing inventory, rising costs may bring some "normalcy" to Western Washington market
Rising interest rates and inflation, coupled with slight improvement in inventory, may bring some normalcy to Western Washington's frenzied housing market suggest some brokers with Northwest Multiple Listing Service.
"The Puget Sound housing market has shifted down several levels of hotness in most areas and is more in alignment with the strong market we saw pre-pandemic," stated J. Lennox Scott, chairman and CEO of John L. Scott Real Estate.
Commenting on a new Northwest MLS report summarizing April activity, Scott noted a "slight increase" in unsold properties, adding, "Not all homes are selling within the first week on market." … At month end, the selection of homes and condos in the database totaled 6,514, the highest level since September 2021 when there were 7,757 total active listings.
Active Inventory in April
Here is a summary of active listings for these housing markets in April. Note: Inventory usually increases seasonally in April, so some month-over-month (MoM) increase is not surprising.
Inventory was up 31.7% in April MoM from March, and up 9.7% year-over-year (YoY). The YoY increase in inventory in these markets was impacted by San Diego (a very tight market). The other markets were up YoY.
These markets were down 26% YoY in February, and unchanged YoY in March, so this is a significant change from February and March. This is another step towards a more balanced market, but inventory levels are still very low.
Notes for all tables:
New additions to table in BOLD.
Northwest (Seattle)
New Listings in April
And here is a table for new listings in April. For these areas, new listings were down 3.2% YoY.
Last month, new listings in these markets were up 4.5% YoY. Once again, San Diego pulled this down. We aren’t seeing a surge in new listings in these markets.
Closed Sales in April
And a table of April sales. Sales in these areas were down 11.9% YoY, Not Seasonally Adjusted (NSA).
Much more to come!