


2nd Look at Local Housing Markets in May

I’ve rearranged these looks at local data with closed sales first, new listings second and active inventory at the end.
I’ve also spelled Raleigh correctly!
Closed sales in May were mostly for contracts signed in March and April, and mortgage rates, according to the Freddie Mac PMMS, averaged 6.65% in March and 6.73% in April. This was a decrease from the average rate for homes that closed in April.
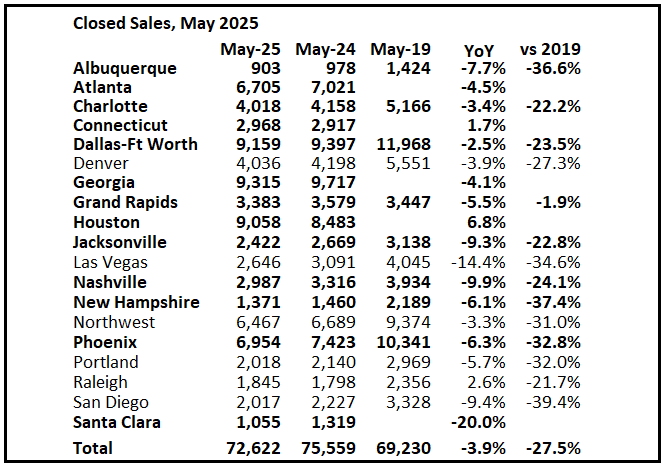
Closed Sales in May
In May, sales in these early reporting markets were down 3.9% YoY. Last month, in April, these same markets were down 1.8% year-over-year Not Seasonally Adjusted (NSA).
Important: There were fewer working days in May 2025 (21) as in May 2024 (22). So, the year-over-year change in the headline SA data will be higher than for the NSA data.
Notes for all tables:
New additions to table in BOLD.
Northwest (Seattle), Jacksonville Source: Northeast Florida Association of REALTORS®
Totals do not include Atlanta (included in state total)
Comparison to 2019 ONLY includes local markets with available 2019 data!
For the previous month (April), there were the same number of working days in April 2025 (22) as in April 2024 (22). So, the NAR reported year-over-year change in the headline SA data (-2.4%) was close to the change in the NSA data (-3.1%) although there are other seasonal factors.
Sales in all of these markets are down compared to May 2019.
This graph shows existing home sales by month for 2024 and 2025, on a Seasonally Adjusted Annual Rate (SAAR) basis. Last year, the NAR reported sales in May 2024 were at 4.06 million SAAR.
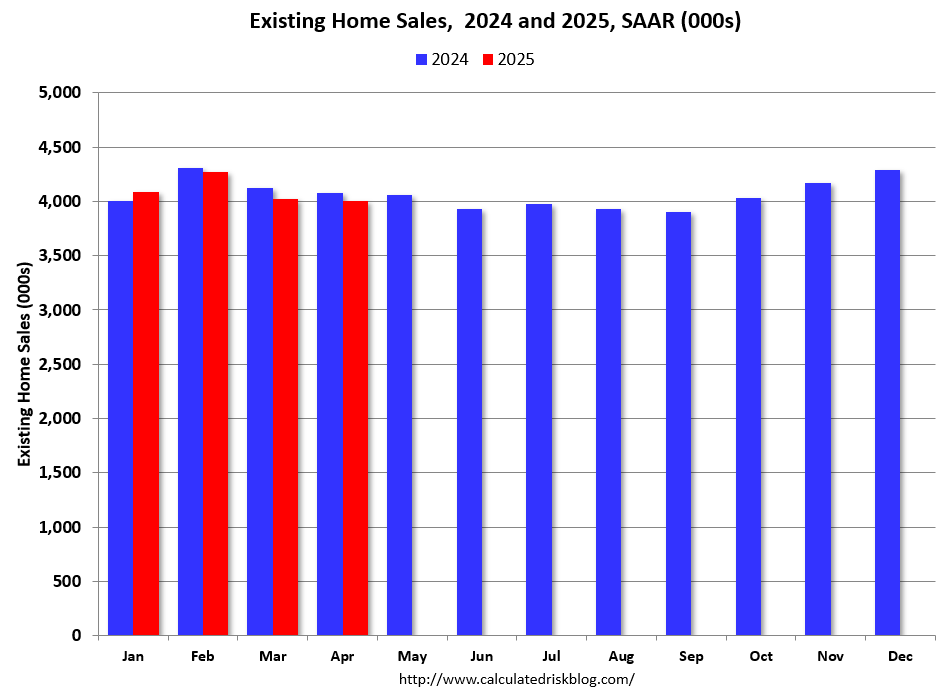
This data suggests that the May existing home sales report will likely be close to April sales (SA) and will likely show a year-over-year decrease for the fourth consecutive month.
Total sales last year (2024) were the lowest since 1995 (lower than any year during the housing bust), so it says something that sales are tracking even lower in 2025!
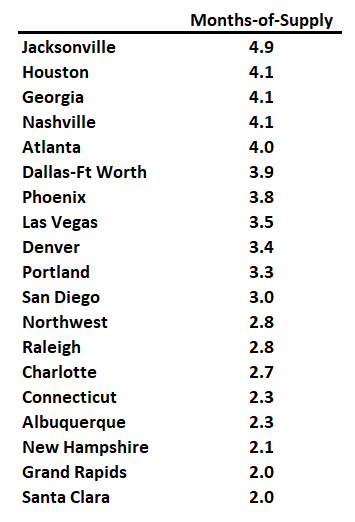
Months of Supply
Here is a look at months-of-supply using NSA sales. Since this is NSA data, it is likely months-of-supply will increase into the Summer.
New Listings in May
For these areas, new listings were up 10.2% year-over-year.
Last month, new listings in these markets were up 13.5% year-over-year.
New listings are now up year-over-year, but down 11.1% compared to May 2019 activity.

Active Inventory in May
Inventory was up 36.9% year-over-year. Last month inventory in these markets was up 40.5% YoY. Inventory is picking up more than usual in the Spring.
Note the significant regional differences.

Many more local markets to come!