CalculatedRisk Newsletter

Share this post
2nd Look at Local Housing Markets in August
calculatedrisk.substack.com

2nd Look at Local Housing Markets in August

Sales and New Listings Down Sharply Year-over-year

CalculatedRisk by Bill McBride
Sep 14, 2022
19
Share this post
2nd Look at Local Housing Markets in August
calculatedrisk.substack.com

This is the second look at local markets in August. I’m tracking about 35 local housing markets in the US. Some of the 35 markets are states, and some are metropolitan areas. I’ll update these tables throughout the month as additional data is released.

The big story for August existing home sales is the sharp year-over-year (YoY) decline in sales. Another key story is that new listings are down YoY in August as the sellers’ strike continues. Of course, active listings are up sharply YoY, but inventory growth has stalled. The increase in inventory so far has been due to softer demand, likely because of higher mortgage rates.

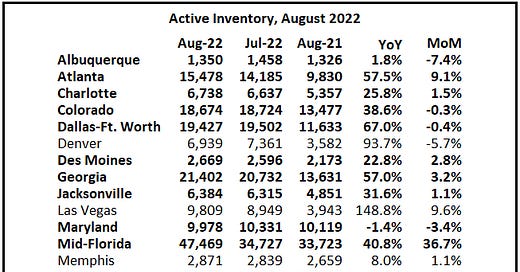
Active Inventory in August

Here is a summary of active listings for these housing markets in August.

Inventory in these markets were down 34% YoY in January, down 8% YoY in April, and are now up 42% YoY! So, this is a significant change from earlier this year, but about the same YoY increase as in July (up 43% YoY).

Notes for all tables:

  1. New additions to table in BOLD.

  2. Northwest (Seattle), Santa Clara (San Jose), Jacksonville, Source: Northeast Florida Association of REALTORS®

  3. Totals do not include Atlanta, Denver (included in state totals)

New Listings in August

And here is a table for new listings in August. For these areas, new listings were down 10.8% YoY. The sellers’ strike has slowed the increase in active inventory.

Last month, new listings in these markets were down 7.5% YoY.

Closed Sales in August

And a table of August sales.

In August, sales in these markets were down 20.2%.

Note that in August 2022, there was one more selling day than in August 2021, so the SA decline in August sales will be larger than the NSA decline.

The opposite was true in July (one more selling day in July 2021 than in July 2022). So, seasonally adjusted, this is probably close to the same YoY decline as in July.

Many more local markets to come!

CalculatedRisk Newsletter is a reader-supported publication. To receive new posts and support my work, consider becoming a free or paid subscriber.

Thank you for reading CalculatedRisk Newsletter. This post is public so feel free to share it.

Share

Share this post
2nd Look at Local Housing Markets in August
calculatedrisk.substack.com
Previous
Next
TopNewCommunity

No posts

Ready for more?

© 2023 CalculatedRisk
Privacy ∙ Terms ∙ Collection notice
Start WritingGet the app
Substack is the home for great writing