Discover more from CalculatedRisk Newsletter
3rd Look at Local Housing Markets in June, Sales Down Sharply, Inventory "Surged"
California Sales down 20.9% Year-over-year
This is the third look at local markets in June. I’m tracking about 35 local housing markets in the US. Some of the 35 markets are states, and some are metropolitan areas. I’ll update these tables throughout the month as additional data is released.
We are seeing a significant change in inventory, and maybe a pickup in new listings. So far, most of the increase in inventory has been due to softer demand - likely because of higher mortgage rates - but we need to keep an eye on new listings too.
We are also seeing a sharp decline in closings in June, and this might be due to buyers cancelling escrow because of the increase in mortgage rates. The NAR will likely report a sharp decline in June sales this coming Wednesday.
California Home Sales and Prices Decline, Inventory “Surged” in June
California doesn’t report monthly inventory numbers, but they do report the year-over-year change. Here is the press release from the California Association of Realtors® (C.A.R.): California home sales and price curb in June as housing demand cools, C.A.R. reports
Closed escrow sales of existing, single-family detached homes in California totaled a seasonally adjusted annualized rate of 344,970 in June, according to information collected by C.A.R. from more than 90 local REALTOR® associations and MLSs statewide. The statewide annualized sales figure represents what would be the total number of homes sold during 2022 if sales maintained the June pace throughout the year. It is adjusted to account for seasonal factors that typically influence home sales. June’s sales pace was down 8.4 percent on a monthly basis from 376,560 in May and down 20.9 percent from a year ago, when 436,020 homes were sold on an annualized basis.
California’s median home price declined 4.0 percent in June to $863,790 from the revised record-high of $900,170 recorded in May. The June price was 5.4 percent higher than the $819,630 recorded last June. The moderation in the median home price was due partly to a change in the mix of sales in June, as the high-end market started pulling back.
With both closed sales and pending sales slowing by more than 20 percent, total active listings surged 64.4 percent in June, the largest year-over-year growth in more than seven years. Active listings in June also climbed to the highest level since November 2019, with a month-to-month increase of 28.8 percent from May.
emphasis added
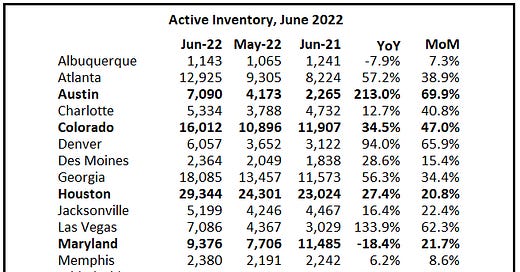
Active Inventory in June
Here is a summary of active listings for these housing markets in June. Inventory usually increases seasonally in June, so some month-over-month (MoM) increase is not surprising. However, for these markets, inventory was up 32% from May to June.
Inventory in these markets were down 29% Year-over-year (YoY) in January, still down 4% YoY in April, and are now up 41% YoY! So, this is a significant change from earlier this year. This is a rapid increase in active inventory, but inventory levels are still historically low in most areas.
Some areas, like Phoenix, are back to 2019 inventory levels. Here is Phoenix active inventory levels over the last 5 years for June:
June 2018: 15,851
June 2019: 15,188
June 2020: 8,792
June 2021: 5,866
June 2022: 15,044 (all the way back and rising rapidly)
Notes for all tables:
New additions to table in BOLD.
Northwest (Seattle), Santa Clara (San Jose), Mid-Florida (Tampa, Orlando), Jacksonville, Source: Northeast Florida Association of REALTORS®
Totals do not include Atlanta, Denver or Minneapolis (included in state totals)
New Listings in June
And here is a table for new listings in June. For these areas, new listings were up 5.2% YoY.
Last month, new listings in these markets were up 6.4% YoY. New listings have increased over the last two months - new listing were down YoY as recently as April - but overall, we aren’t seeing a huge surge in new listings in these markets.
Closed Sales in June
And a table of June sales. Sales in these areas were down 16.5% YoY, Not Seasonally Adjusted (NSA). Some of the decline in sales in June could be due to cancelled contracts.
Here is a table comparing the year-over-year Not Seasonally Adjusted (NSA) declines in sales this year from the National Association of Realtors® (NAR) with the local markets I track. So far, these measures have tracked closely, and the preliminary data below suggests a sharp decline in sales in June.
Housing economist Tom Lawler expects the NAR to report sales at a seasonally adjusted annual rate of 5.12 million in June. The consensus is for 5.40 million.
Contracts for sales in June were mostly signed in April and May, when mortgage rates were lower than in June, so we will probably see further declines in sales in July and August
More to come!