Discover more from CalculatedRisk Newsletter
3rd Look at Local Housing Markets in October
Albuquerque, Atlanta, Colorado, Georgia, Houston, Jacksonville, Minnesota, Portland, Sacramento and Santa Clara
This is the third look at local markets in October. This update adds Albuquerque, Atlanta, Colorado, Houston, Jacksonville, Minnesota, Portland, Sacramento and Santa Clara.
I’m tracking about 30 local housing markets in the US. Some of the 30 markets are states, and some are metropolitan areas. I’ll update these tables throughout the month as additional data is released.
My view is that if the housing market is slowing, it will show up in inventory (not yet!).
The following data is important, especially active inventory and new listings. One of the key factors for house prices is supply, and tracking local inventory reports will help us understand what is happening with supply.
On a national basis, it is possible inventory will be up year-over-year sometime during the winter months, but inventory will still be at very low levels. It is also possible that we will see record lows over the Winter.
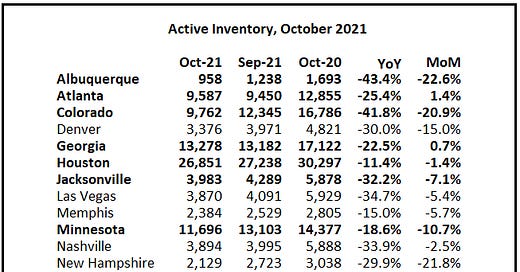
Active Inventory in October
Here is a summary of active listings for the housing markets that have reported so far in October. For these markets, inventory was down 7.9% in October MoM from September, and down 25.1% YoY.
Of the markets that have reported so far, inventories in Jacksonville and San Diego are at record lows. Sacramento is the only market so far with inventory up YoY in October.
Inventory almost always declines seasonally in October, so the MoM decline is not a surprise. Last month, these markets were down 22.9% YoY, so the YoY decline in October is slightly larger than in September. This is not indicating a slowing market.
Notes for all tables:
New additions to table in BOLD.
Northwest (Seattle), North Texas (Dallas), and Santa Clara (San Jose)
Totals do not include Atlanta or Denver (included in state totals).
Please share with your friends and colleagues!
New Listings in October
And here is a table for new listings in October. For these areas, new listings were down 9.4% YoY. That is a significantly larger decline than last month (September), when new listings in these markets was down 1.7% YoY.
Note: Not all areas report new listings.
Closed Sales in October
And a table of October sales. Sales for these markets were down 8.6% YoY, Not Seasonally Adjusted (NSA).
This is just over half of the local markets that I track. There is much more to come!!!
Please subscribe for housing data and analysis.