


3rd Look at Local Housing Markets in May

The NAR is scheduled to release May existing home sales on Monday, June 23rd at 10:00 AM. Housing economist Tom Lawler expects the NAR to report sales at a seasonally adjusted annual rate (SAAR) of 4.03 million for May, up slightly from April and down slightly year-over-year.
Closed Sales in May
In May, sales in these markets were down 4.3% YoY. Last month, in April, these same markets were down 3.4% year-over-year Not Seasonally Adjusted (NSA).
Important: There were fewer working days in May 2025 (21) as in May 2024 (22). So, the year-over-year change in the headline SA data will be higher than for the NSA data.
Notes for all tables:
New additions to table in BOLD.
Northwest (Seattle), Jacksonville Source: Northeast Florida Association of REALTORS®
Totals do not include Atlanta and Denver (included in state totals)
Comparison to 2019 ONLY includes local markets with available 2019 data!

For the previous month (April), there were the same number of working days in April 2025 (22) as in April 2024 (22). So, the NAR reported year-over-year change in the headline SA data (-2.4%) was close to the change in the NSA data (-3.1%) although there are other seasonal factors.
Sales in all of these markets are down compared to May 2019.
This data suggests that the May existing home sales report will likely be close to April sales (SA) and may show a year-over-year decrease for the fourth consecutive month.
Total sales last year (2024) were the lowest since 1995 (lower than any year during the housing bust), so it says something that sales are tracking even lower in 2025!
Months of Supply
Here is a look at months-of-supply using NSA sales. Since this is NSA data, it is likely months-of-supply will increase into the Summer.

New Listings in May
For these areas, new listings were up 6.3% year-over-year.
Last month, new listings in these markets were up 9.7% year-over-year.
New listings are now up year-over-year, but down 10.2% compared to May 2019 activity.

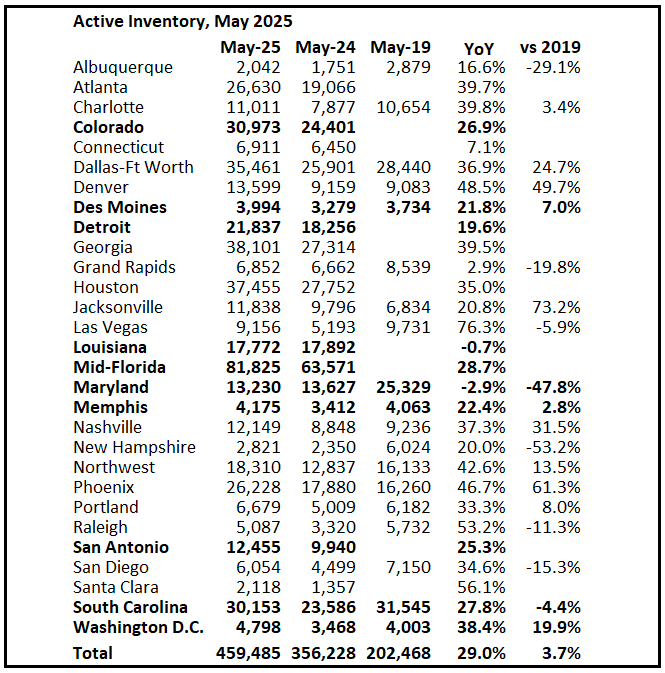
Active Inventory in May
Inventory was up 29.0% year-over-year. Last month inventory in these markets was up 31.9% YoY. Inventory is picking up more than usual in the Spring.
Note the significant regional differences.
More local markets to come!
Can you share more data about the Miami market? A few months ago I believe you shared charts showing 9.8 months of inventory and a slowing sales rate. Would like to see if things are same or different.