


3rd Look at Local Housing Markets in November with Comparison to 2019

NOTE: The tables for active listings, new listings and closed sales all include a comparison to November 2019 for each local market (some 2019 data is not available).
This is the third look at several early reporting local markets in November. I’m tracking about 40 local housing markets in the US. Some of the 40 markets are states, and some are metropolitan areas. I’ll update these tables throughout the month as additional data is released.
Closed sales in November were mostly for contracts signed in September and October. Since 30-year fixed mortgage rates were in the 7.2% in September, and 7.6% in October, compared to the mid-6% range the previous year, closed sales were down year-over-year in November.
Active Inventory in November
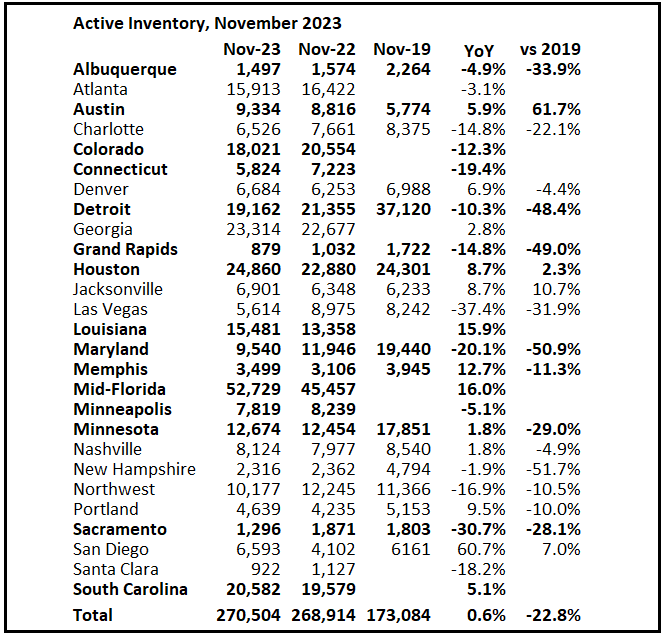
Here is a summary of active listings for these housing markets in November.
There are significant regional differences when comparing to 2019 levels. For example, inventory is up in 62% in Austin compared to November 2019, and down 51% in Maryland.
Inventory for these markets were down 3.0% YoY in October and are now up 0.6% YoY. Other measures indicate active inventory will be up further YoY in December.
For markets with available data, inventory is down 23% compared to November 2019.
Notes for all tables:
New additions to table in BOLD.
Northwest (Seattle), Jacksonville Source: Northeast Florida Association of REALTORS®
Totals do not include Atlanta, Denver and Minneapolis (included in state totals)
Comparison to 2019 ONLY includes local markets with available 2019 data!

New Listings in November
And here is a table for new listings in November (some areas don’t report new listings). For these areas, new listings were up 6.1% YoY.
Keep reading with a 7-day free trial
Subscribe to CalculatedRisk Newsletter to keep reading this post and get 7 days of free access to the full post archives.