
A few comments on the Weak Start for 2026 Existing Home Sales

First, I’m neither a housing permabear or a permabull. For example, starting in January 2005, I was very bearish on housing - and in early 2007, I predicted a recession. Then, a few years later, in early 2012, when many people were still bearish on housing, I called the bottom for housing: The Housing Bottom is Here. I’m data driven and I try to pay attention to the fundamentals.
As I noted in this post earlier this month, 2026 is off to a weak start: NAR: Existing-Home Sales Increased to 4.09 million SAAR in February
“Year-to-date, NSA, sales are down 2.4% compared to the same period in 2025. And sales in 2025 tied 2024 as the lowest level since 1995! 2026 is off to a weak start.”
I explained a couple of reasons why in The Gaping Hole in the Housing Market.
This morning, the NAR reported: NAR Pending Home Sales Report Shows 1.8% Increase in February. This is mostly for closed sales in March and April, and the key number is that year-over-year there was a “0.8% decrease in pending home sales”. So there are no signs of a pickup yet.
But wait, what about the MBA purchase index? That is up from the lows. Here is a graph through the release last week. The index has clearly increased over the last year or so. And yet, sales in 2025 were as weak as 2024, even with the increase in the purchase index. I’ll explain.
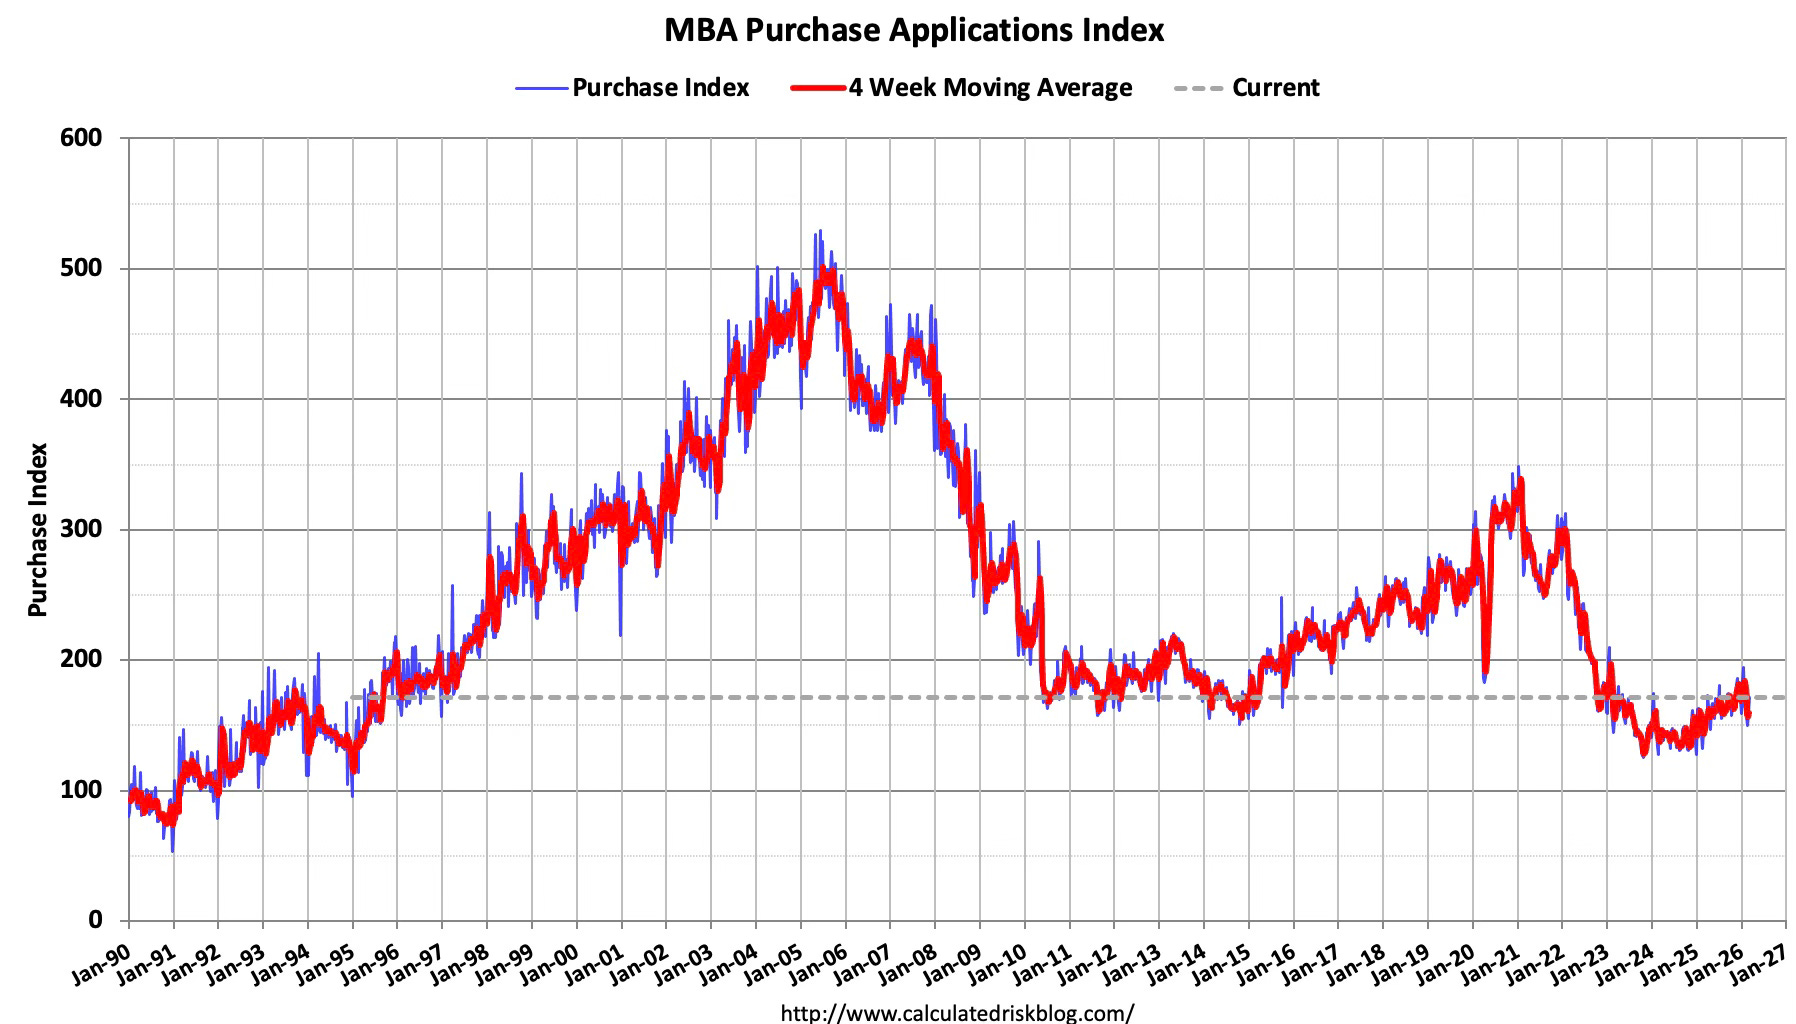
Way back in October 2006 then Fed Chair Alan Greenspan argued that the worst was over for housing using the MBA purchase index:
“I suspect that we are coming to the end of this downtrend, as applications for new mortgages, the most important series, have flattened out.” Fed Chair Greenspan, October, 2006
He couldn’t have been more wrong. I disagreed, and argued the housing bust was just getting started.
And then the index increased in 2007 - even though the housing bust was getting worse. What happened? The MBA index is a survey of mortgage companies, but doesn’t include all participants in the market. What happened in 2007 is that many of the companies not included in the index were going out of business! That meant buyers were applying at the remaining companies - those that were included in the index - and this pushed up the index even though the housing market was collapsing!
What about now? Even though the index is up, it is still about 29% below the average in the 2017-2019 period. And guess what? Sales over the last year are down about 25% from the 2017-2019 period. So the purchase index at the current level is suggesting weak sales.
Why is the index up over the last year? There are several possibilities: 1) some pickup in demand, 2) Fewer cash buyers (this would lead to more purchase applications at the same level of sales), and 3) a small shift from lenders not in the index to lenders included in the index.
Although we can’t be sure, my guess is there has been a shift to lenders included in the index. But the key is that it is important to use caution when using this index.
This year the existing home market is off to a weak start and there is no clear evidence of a pickup in sales.