The following data is courtesy of David Arbit, Director of Research at the Minneapolis Area REALTORS® and NorthstarMLS (posted with permission). Here is a link to their data.
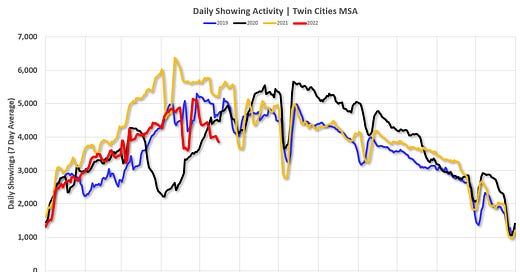
The first graph shows the 7-day average showings for the Twin Cities area for 2019, 2020, 2021, and 2022.
There was a huge dip in showings in 2020 (black) at the start of the pandem…
Keep reading with a 7-day free trial
Subscribe to CalculatedRisk Newsletter to keep reading this post and get 7 days of free access to the full post archives.


