

Architecture Billings Index in Contraction for 46 of Last 47 Months
This index is a leading indicator primarily for new Commercial Real Estate (CRE) investment including multi-family residential.
From the AIA: Architecture firm billings continued to decline in August
The AIA/Deltek Architecture Billings Index ® (ABI) score for the month was 47.2. While slightly fewer firms reported a decline in billings in August than in July, the majority of firms continued to see weak business conditions. In addition, inquiries into new projects showed only modest growth this month, while the value of newly signed design contracts continued to decline. And sentiment about future billings has weakened at architecture firms as well. When we first asked this new question at the end of the first quarter, 31% of responding firm leaders indicated that they expected billings to increase in the second quarter. That basically held steady at 30% when asked about the third quarter, but has now fallen to 25% when asked about expectations for the fourth quarter. Additionally, the share of responding firm leaders who expect billings to decline in the coming quarter has increased from 21% at the end of the first quarter to 29% at the end of the third quarter.
Despite billings declining overall, firms in some regions saw better conditions in August. Firms located in the Midwest reported modest growth for the first time in nearly a year, while billings were essentially flat at firms located in the West. However, billings softened significantly at firms located in the Northeast, reaching their lowest level since 2020. Billings also varied significantly by firm specialization, as firms with a commercial/industrial specialization saw a slight uptick in August. However, business conditions remained soft at firms of all other specializations, despite firms with institutional and multifamily residential specializations seeing slight growth earlier this year.
...
The ABI serves as a leading economic indicator that leads nonresidential construction activity by approximately 9-12 months.
emphasis added
• West (49.8); Midwest (50.7); South (46.1); Northeast (40.7)
• Sector index breakdown: institutional (47.0); commercial/industrial (50.4); multifamily residential (47.8).
This graph shows the Architecture Billings Index since 1996. The index was at 47.2 in August, up from 46.6 in July Anything below 50 indicates a decrease in demand for architects’ services. This index has indicated contraction for 46 of the last 47 months.
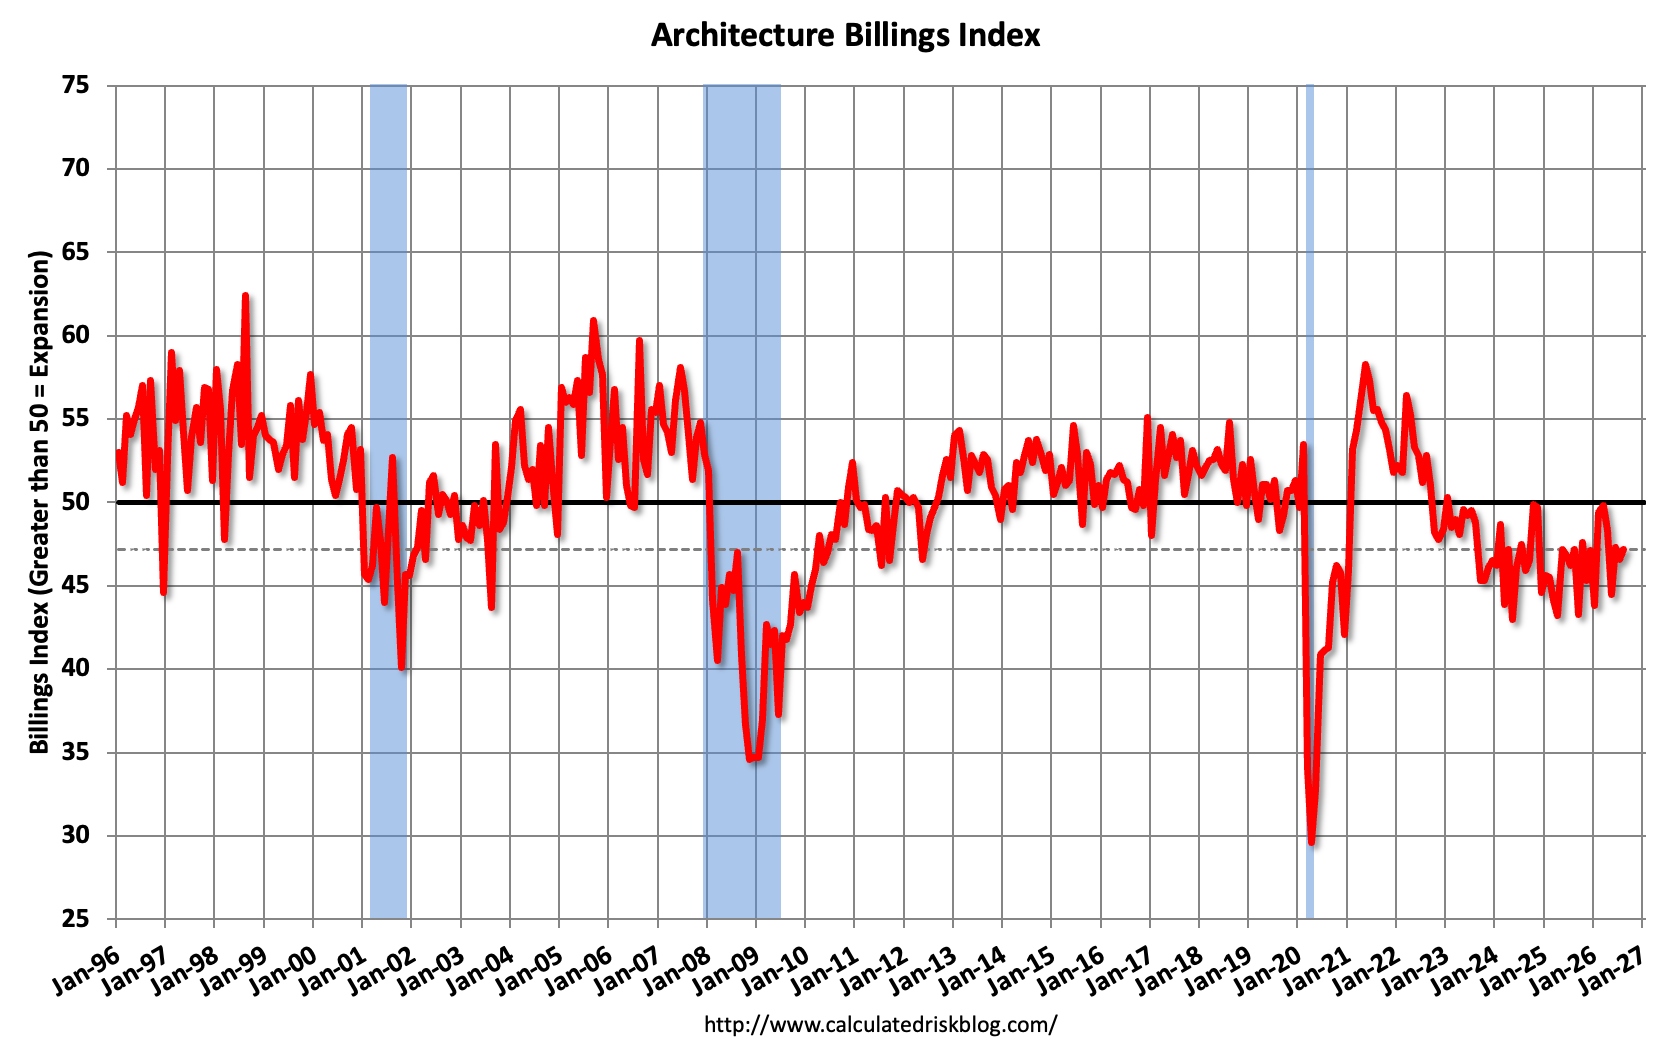
Note: This includes commercial and industrial facilities like hotels and office buildings, multi-family residential, as well as schools, hospitals and other institutions. This index typically leads CRE investment by 9 to 12 months, so this index suggests a slowdown in CRE investment into 2027.
This slump wasn’t as sharp as during the housing bust, but has lasted longer.
Multi-family billings have been below 50 for 47 of the last 49 months.