Tracking rents is important for understanding the dynamics of the housing market. For example, the sharp increase in rents helped me deduce that there was a surge in household formation in 2021 (See from September 2021: Household Formation Drives Housing Demand).
The surge in household formation has been confirmed (mostly due to work-from-home), and this led to the supposition that household formation would slow sharply in 2023 (mostly confirmed) and that asking rents might decrease in 2023 on a year-over-year basis (now negative year-over-year).
Recent data suggests household formation has slowed sharply and asking rents are declining year-over-year.
First, a survey of rent reports …
Apartment List: Asking Rent Growth -1.2% Year-over-year
From ApartmentList.com: Apartment List National Rent Report
Welcome to the October 2023 Apartment List National Rent Report. The rental market continued slowing down this month, as the nationwide median rent fell 0.5 percent to $1,364. This being the second consecutive month with negative rent growth, we are now squarely in the rental market’s slow season.
Annual rent growth remains at -1.2 percent, meaning that on average, apartments across the country are 1.2 percent cheaper today than they were one year ago. This is a major deceleration from recent years, when annual rent growth neared 18 percent nationally and soared to over 40 percent in a handful of popular cities.
This cooldown is widespread; rents fell month-over-month in September in 85 of the nation’s 100 largest cities, and thanks to sluggish rent growth over the past 12 months, prices are down year-over-year in 71 of these 100 cities. …
This is the steepest September rent drop captured by our index. From 2018-2020, September declines ranged from -0.1 to -0.3 percent. September 2021 was an obvious anomaly, when rents rose nearly 2 percent during a period of rapid, widespread rent hikes. But by mid-2022 a sluggish rental market had formed, and a rent decline of 0.4 percent last September was followed up by a 0.5 percent decline this past month. …
[A]fter bottoming out in October 2021, our national vacancy index has been easing steadily for nearly two years. Apartment vacancies have increased for 23 consecutive months, and in September the index hit 6.4 percent, reaching pre-pandemic levels and approaching the pandemic peak set in 2020.
This easing has begun to level out a bit in recent months, but there’s still a good chance that the vacancy rate will continue trending upward in the months ahead. New apartment construction is recovering from pandemic-related disruptions, and there are now more multifamily units under construction than at any point since 1970. As this new inventory continues to hit the market over the remainder of this year and into next, we are now entering a phase in which property owners are beginning to compete for renters to fill their units, a marked change from the prevailing conditions of the past two years, in which renters had been competing for a limited supply of available inventory.
emphasis added
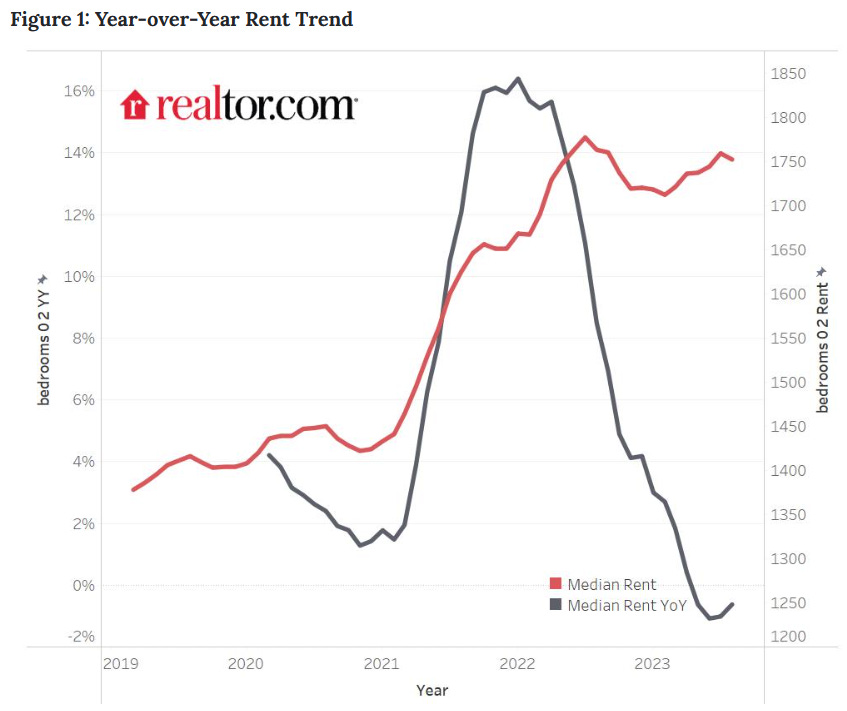
Realtor.com: Fourth Consecutive Month with Year-over-year Decline in Rent
From Realtor.com: August 2023 Rental Report: Renting A Starter Home Is A More Affordable Option Than Buying in All but Three of the Largest U.S. Metros
In August 2023, the U.S. median rent continued to see a year-over-year decline for the fourth month in a row, down -0.6% for 0-2 bedroom properties across the top 50 metros, slightly lower than the rate of -1.0% seen in July. The median asking rent was $1,752, down by $7 from last month and $25 less from the peak seen in July 2022. However, it was still $336 (23.7%) higher than the same time in 2019 (pre-pandemic).
CoreLogic: “15th consecutive month of deceleration”
CoreLogic also tracks rents for single family homes: Annual US Single-Family Rent Growth Drops to Almost Three-Year Low in July, CoreLogic Reports
U.S. single-family rents posted a 3.1% year-over-year gain in July, the 15th consecutive month of deceleration but in line with pre-pandemic trends. …
“While U.S. single-family rent growth has now reverted to its long-term average of about 3%, three U.S. metros recorded annual cost decreases in July,” said Molly Boesel, principal economist for CoreLogic. “However, because the SFRI peaked in these metros in July 2022, the annual decreases represent a plateauing of costs rather than larger weaknesses in single-family rental markets.”
The 3.1% YoY increase in July was down from 3.3% in June.
Real Page: “Year-over-year, same-store effective asking rents for new leases inched up just 0.28% in August”
From Jay Parsons at Real Page: Apartment Rent Growth Continues its Rapid Descent in August
Year-over-year, same-store effective asking rents for new leases inched up just 0.28% in August and remained on track to potentially turn negative by September. That’s a sharp turn from one year ago, when rent growth measured 11%.
Rent Data
Here is a graph of several measures of rent since 2000: OER, rent of primary residence, Zillow Observed Rent Index (ZORI), ApartmentList.com and CoreLogic Single Family Rental Index (All set to 100 in January 2017)
Keep reading with a 7-day free trial
Subscribe to CalculatedRisk Newsletter to keep reading this post and get 7 days of free access to the full post archives.


