Tracking rents is important for understanding the dynamics of the housing market. Slower household formation and increased supply (more multi-family completions) has kept asking rents under pressure.
More recently, immigration policy has become a negative for rentals.
Rents are up 0.4% month-over-month, down 0.5% year-over-year
Welcome to the June 2025 Apartment List National Rent Report. Our national rent index increased by 0.4 percent in May, but despite rents ticking up for the fourth consecutive month, rent growth is currently slowing at the time of year when it typically ramps up. Slow rent growth in May caused year-over-year rent growth dip to further negative, falling to -0.5 percent, after having gradually inched closer to positive territory over the prior six months. In dollar terms, the national median monthly rent now stands at $1,398, up $5 per month compared to last month, but down $6 compared to May 2024.
Since the second half of 2022, rent prices have continued to ebb and flow with the seasons as they typically do, but with the overall trajectory trending modestly downward. Following a period of record-setting rent growth through 2021 and the first half of 2022, the national median rent has now fallen below its August 2022 peak by a total of 3.1 percent, or $44 per month. But despite the cooldown, the typical rent price remains 22 percent higher than its January 2021 level.
On the supply side of the rental market, our national vacancy index currently sits at 7 percent, marking a new record high in the history of that monthly data series, which goes back to the start of 2017. After a historic tightening in 2021, multifamily occupancy has been slowly but consistently easing for over three years amid an influx of new inventory. 2024 saw the most new apartment completions since the mid-1980s, and although we’re past the peak of new multifamily construction, this year is still bringing a robust level of new supply.
Realtor.com: 21st Consecutive Month with Year-over-year Decline in Rents
In April 2025, U.S. median rent posted its 21st consecutive year-over-year decline, dropping 1.7% for 0–2 bedroom properties across the 50 largest metropolitan areas. The median asking rent stood at $1,699—just $5 higher than the previous month—reflecting a typical seasonal uptick as rents tend to rise in the spring and summer before softening in the fall and winter. However, this spring’s monthly increase was more modest than last year’s, signaling a cooling rental market.
Cotality: Single Family Rents Up 2.8% year-over-year
Single-family rent prices continued trending upward for the third month in a row, increasing 2.9% year over year. This is a slight increase from March 2024, when rent prices grew 2.8% year over year.
“Single-family rent growth picked up for the third consecutive month in March, appearing to have bottomed out in December of last year,” said Molly Boesel, Cotality senior principal economist. “National trends are firming. Markets with large numbers of new rental units coming online showed softness in single-family rents, as these new units give renters some bargaining power. This can be seen in the single-family rent growth in Dallas, which showed an annual decrease of 0.5% in March.”
Real Page on April Rents: Annual Rent Growth of 1.0%
U.S. apartment occupancy registered at 95.7% in April after climbing 40 basis points (bps) month-over-month to mark the strongest monthly boost in an April reading since 2010, according to data from RealPage Market Analytics. April generally marks the start of prime leasing season, though typical seasonality has been disrupted in recent years.
Effective rents grew 0.2% in April, the softest showing in four months, toning down annual rent growth to 1.0% after slightly higher readings in March. The high-supply South continued to be the only region cutting rents on an annual basis (-0.5%), while the West posted near negligible growth (0.5%). The Midwest (3.6%) and Northeast (3.3%) again posted the strongest rent growth among regions in the year-ending April 2025.
The typical asking rent is $2,024 in April, up 0.5% month-over-month. The pre-pandemic average month-over-month change for this time of year is 0.7%.
Since the beginning of the pandemic, rents have increased by 35.4%.
Rents are now 3.4% up from last year.
Rent Data
Here is a graph of several measures of rent since 2000: OER, rent of primary residence, Zillow Observed Rent Index (ZORI) and ApartmentList.com (All set to 100 in January 2017).
OER and rent of primary residence have mostly moved together. The Zillow index started in 2015 and the ApartmentList index started in 2017.
Note that new lease measures (Zillow, Apartment List) dipped early in the pandemic, whereas the BLS measures were steady. Then new leases took off, and the BLS measures have followed.
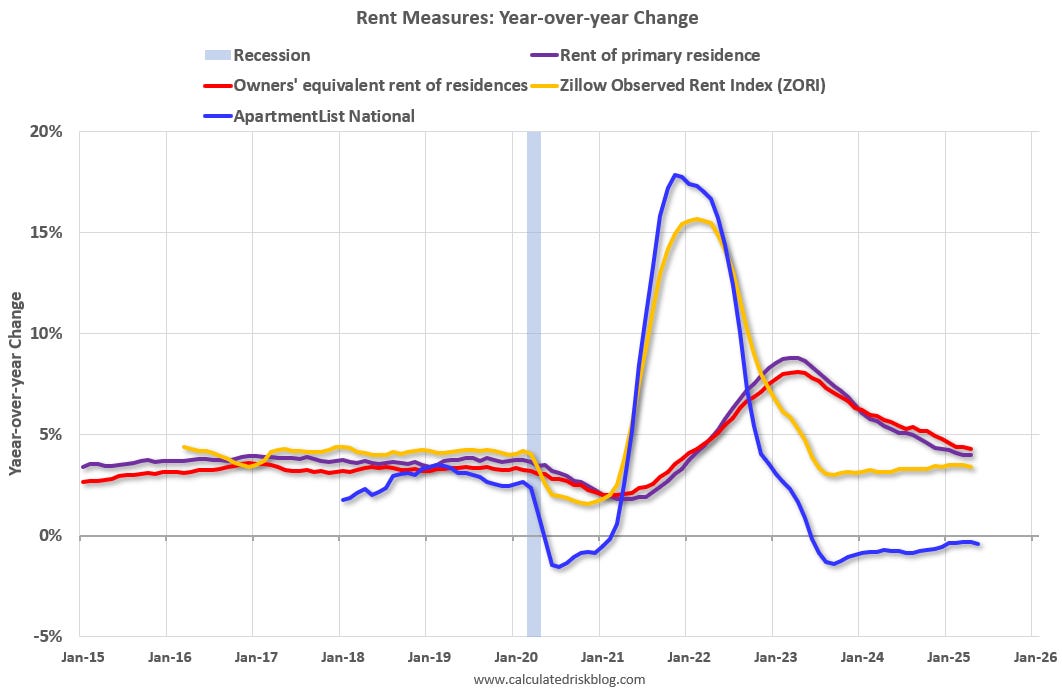
Here is a graph of the year-over-year (YoY) change for these measures since January 2015. Most of these measures are through April 2025, except Apartment List through May 2025.
The Zillow measure (single and multi-family) is up 3.4% YoY in April, down from 3.5% YoY in March, and down from a peak of 15.7% YoY in February 2022.
The ApartmentList measure is -0.4% YoY as of May, down from -0.3% in April, and down from a peak of 17.9% YoY November 2021.
The ApartmentList measure reflects new leases, whereas most rental units don’t turnover every year (as captured by the BLS measures). The sharp increase in new lease rates in 2021 and early 2022 has been spilling over into the consumer price index (as discussed in earlier article).
The Rent of primary residence was up 4.0% YoY in April, unchanged from 4.0% YoY in March. The Owners’ Equivalent Rent (OER) was up 4.3% YoY in April, down from 4.4% YoY in March. The YoY change in OER and in PCE will stay elevated for some time, even though asking rent growth has mostly flattened YoY.
Conclusion
The story mostly remains the same although it might start to change later this year. There will still be a significant amount of new supply coming on the market in 2025, but the pace of new supply is declining.
However, it is possible that policy (less immigration, more deportations) could put more downward pressure on rents. The tariffs might also hurt rentals - indirectly - since renters will be paying more for other goods.
The government measures of housing inflation (CPI and PCE reports) will likely continue to slowly decline throughout 2025.
CalculatedRisk Newsletter is a reader-supported publication. To receive new posts and support my work, consider becoming a free or paid subscriber.
Thanks for reading CalculatedRisk Newsletter! This post is public so feel free to share it.