Discover more from CalculatedRisk Newsletter
Atlanta Fed: Home Ownership Affordability Monitor
For house prices, there is an ongoing battle between low inventory and affordability. Here is another measure of affordability that readers might find useful from the Atlanta Fed: Home Ownership Affordability Monitor
To help business economists and analysts track the relative changes in home ownership affordability at a higher frequency and more granular level of geography, the Atlanta Fed developed an interactive home affordability tool, the HOAM (Home Ownership Affordability Monitor) Index, which measures the ability of a median-income household to absorb the estimated annual costs associated with owning a median-priced home. Using the HUD standard 30 percent share of income threshold to measure affordability, this tool presents a national view of affordability for the median home owner from January 2006 through the most current data as well as metro-level and county-level (within metropolitan areas) views of affordability for the median home owner from January 2014 through the most current data.
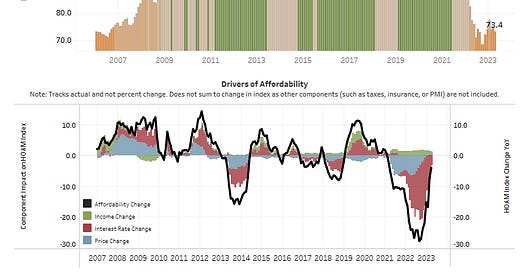
Here is a graph of affordability (higher is more affordable), and of the year-over-year change in affordability through April 2023. By this measure, houses are close to the least affordable since 2007. (Note that the Atlanta Fed projects income.)
Since April, both house prices and mortgage rates have increased, and affordability is even worse.
The Atlanta Fed also calculates affordability by metro area.
I’ll have some comments on this tomorrow.