
Calculated Risk Returns!
Existing Home Sales Increased to 3.95 million SAAR in July

I'm back from Africa! I’ll be catching up on recent data over the next week, and I’ll post some photos / videos from my trip.
This lion walked right past us in the Serengeti National Park in Tanzania.

Existing Home Sales Increased to 3.95 million SAAR in July
From the NAR: Existing-Home Sales Advanced 1.3% in July, Ending Four-Month Skid
Existing-home sales improved in July, breaking a streak of four consecutive monthly declines, according to the National Association of REALTORS®. Three out of four major U.S. regions registered sales increases while the Midwest remained steady. Year-over-year, sales rose in the Northeast and West but retreated in the Midwest and South.
Total existing-home sales – completed transactions that include single-family homes, townhomes, condominiums and co-ops – ascended 1.3% from June to a seasonally adjusted annual rate of 3.95 million in July. Year-over-year, sales fell 2.5% (down from 4.05 million in July 2023).
...
Total housing inventory registered at the end of July was 1.33 million units, up 0.8% from June and 19.8% from one year ago (1.11 million). Unsold inventory sits at a 4.0-month supply at the current sales pace, down from 4.1 months in June but up from 3.3 months in July 2023.
emphasis added
The sales rate was slightly above the consensus forecast, but at housing economist Tom Lawler’s estimate.

Sales in July (3.95 million SAAR) were up 1.3% from the previous month and were 2.5% below the July 2023 sales rate.
Housing Inventory Increased in July
The second graph shows nationwide inventory for existing homes.
According to the NAR, inventory increased to 1.33 million in July from 1.32 million the previous month.

Headline inventory is not seasonally adjusted, and inventory usually decreases to the seasonal lows in December and January, and peaks in mid-to-late summer. The third graph shows the year-over-year (YoY) change in reported existing home inventory and months-of-supply. Since inventory is not seasonally adjusted, it really helps to look at the YoY change. Note: Months-of-supply is based on the seasonally adjusted sales and not seasonally adjusted inventory.
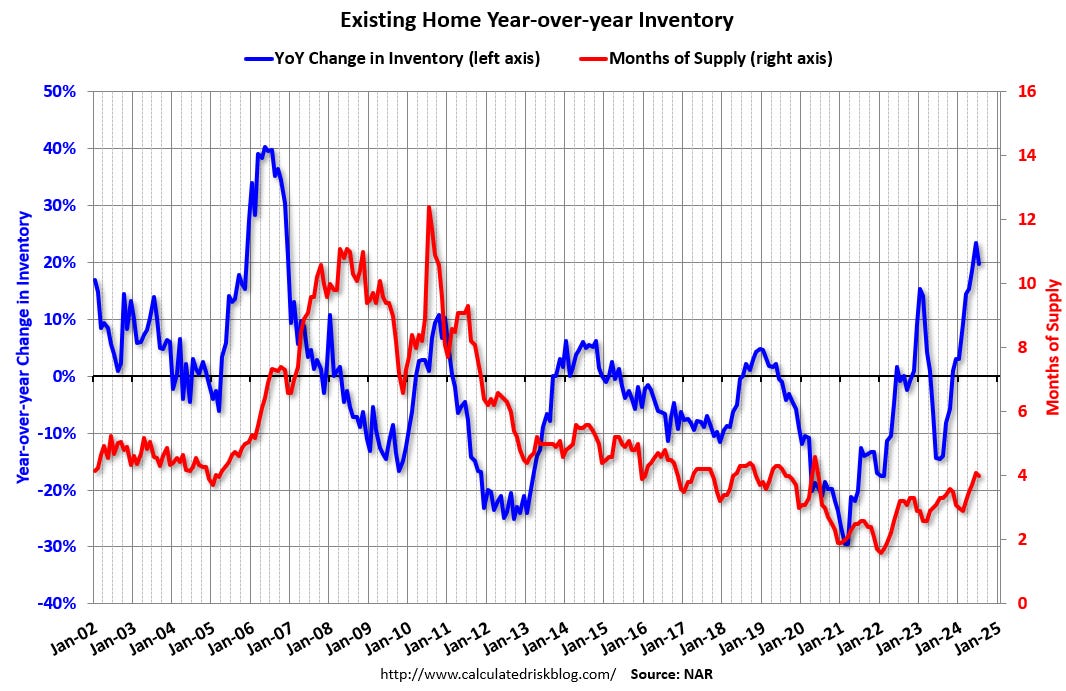
Inventory was up 19.8% year-over-year (blue) in July compared to July 2023. Months of supply (red) decreased to 4.0 months in July from 4.1 months the previous month.
Looking back to pre-pandemic levels, in July 2019 months-of-supply was at 4.2 months, so there is less supply now, on a months-of-supply basis, than prior to the pandemic - but months-of-supply is getting close to 2019 levels! Even though sales have declined significantly compared to 2019, inventory has fallen even more - pushing down months-of-supply.
Sales Year-over-Year and Not Seasonally Adjusted (NSA)
The fourth graph shows existing home sales by month for 2023 and 2024.
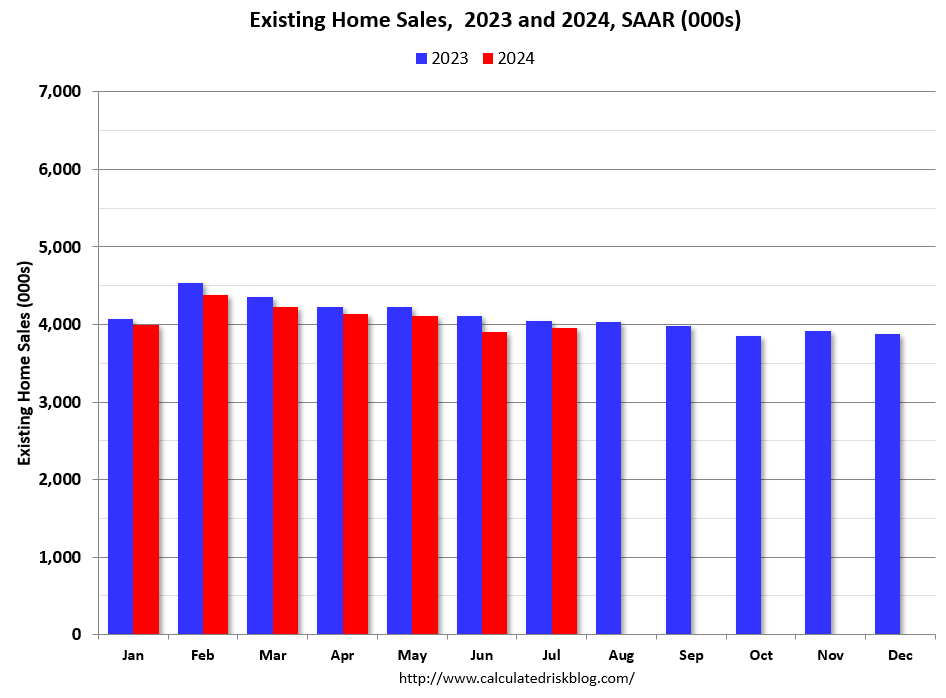
Sales declined 2.5% year-over-year compared to July 2023. This was the thirty-fifth consecutive month with sales down year-over-year.
The following content is for paid subscribers only. Thanks to all paid subscribers!