


California Home Sales "Sputter" in May; 4th Look at Local Markets
California Active Inventory Highest Reached 67-Month High

Here a few more local markets prior to the NAR release on Monday.
The NAR is scheduled to release May existing home sales on Monday, June 23rd at 10:00 AM. Housing economist Tom Lawler expects the NAR to report sales at a seasonally adjusted annual rate (SAAR) of 4.03 million for May, up slightly from April and down slightly year-over-year.
California reports seasonally adjusted sales and some measures of inventory.
From the California Association of Realtors® (C.A.R.): California housing market sputters for third straight month in May as home sales and prices pull back, C.A.R. reports
California’s housing market continues to face headwinds as lingering tariff wars, ongoing economic uncertainty, and elevated mortgage interest rates undermined buyer confidence and dampened homebuyer demand in May, CALIFORNIA ASSOCIATION OF REALTORS® (C.A.R.) said today.
Closed escrow sales of existing, single-family detached homes in California totaled a seasonally adjusted annualized rate of 254,190 in May, according to information collected by C.A.R. from more than 90 local REALTOR® associations and MLSs statewide. The statewide annualized sales figure represents what would be the total number of homes sold during 2025 if sales maintained the May pace throughout the year. It is adjusted to account for seasonal factors that typically influence home sales.
May’s sales pace fell 5.1 percent from the 267,710 homes sold in April and was down 4.0 percent from a year ago, when 264,850 homes were sold on an annualized basis. May’s sales level was the lowest in four months. The year-over-year decline was the largest since December 2023, and the monthly decline was the first in 17 months. Year-to-date sales barely exceeded the same timeframe in 2024 and could dip below last year’s level in June if the market continues to lose momentum. …
After recording a new high in April, the California median price pulled back in May but remained above the $900,000 benchmark. The May median price of $900,170 declined 1.1 percent from April and was down 0.9 percent from $908,000 in May 2024. The monthly decline was below the historical average of +1.2 percent recorded between April and May. The statewide median price decline can be attributed to multiple factors including elevated interest rates, insurance availability/affordability, economic uncertainty and home sellers’ willingness to reduce prices. Home prices will likely come down further from April’s record high as the market enters the second half of the year. Seasonality will play a role in the price moderation, and an increase in housing supply will also relieve upward price pressure. …
• May’s unsold inventory index (UII) climbed from the prior month as demand slowed while supply continued to grow. The UII measures the number of months needed to sell the supply of homes on the market at the current sales rate. The index was 3.8 months in May, up from 3.5 months in April and up from 2.6 months in May 2024. Total active listings in May rose on a year-over-year basis by nearly 50 percent and had been increasing at a double-digit growth rate for the last 15 months. The level of active listings last month reached a 67-month high and recorded its 16th consecutive month of annual gain in housing supply.• New active listings at the state level jumped year-over-year by double-digits for the fifth straight month, as more properties continued to be listed onto the market. Newly added units continued to surge last month, growing 3.5 percent month-over-month and 22.8 percent year-over-year in May. Despite the increase from the prior month, the monthly gain in new active listings was the smallest April-to-May increase in the past four years.
emphasis added
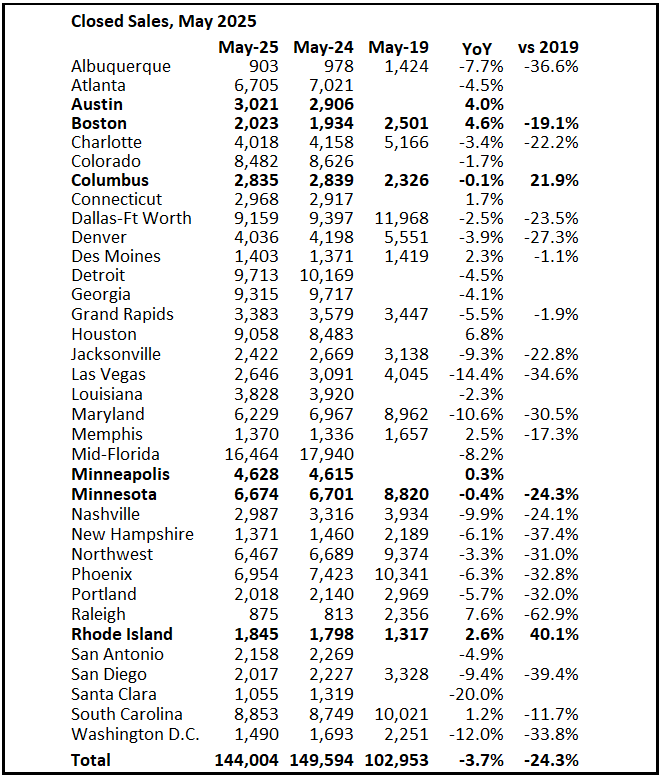
Closed Sales in May
In May, sales in these markets were down 3.7% YoY. Last month, in April, these same markets were down 3.4% year-over-year Not Seasonally Adjusted (NSA).
Important: There were fewer working days in May 2025 (21) as in May 2024 (22). So, the year-over-year change in the headline SA data will be higher than for the NSA data.
Notes for all tables:
New additions to table in BOLD.
Northwest (Seattle), Jacksonville Source: Northeast Florida Association of REALTORS®
Totals do not include Atlanta, Denver and Minneapolis (included in state totals)
Comparison to 2019 ONLY includes local markets with available 2019 data!
For the previous month (April), there were the same number of working days in April 2025 (22) as in April 2024 (22). So, the NAR reported year-over-year change in the headline SA data (-2.4%) was close to the change in the NSA data (-3.1%) although there are other seasonal factors.
Sales in all of these markets are down compared to May 2019.
This data suggests that the May existing home sales report will likely be close to April sales (SA) and may show a year-over-year decrease for the fourth consecutive month.
Total sales last year (2024) were the lowest since 1995 (lower than any year during the housing bust), so it says something that sales are tracking even lower in 2025!
Months of Supply
Here is a look at months-of-supply using NSA sales. Since this is NSA data, it is likely months-of-supply will increase into the Summer.
6
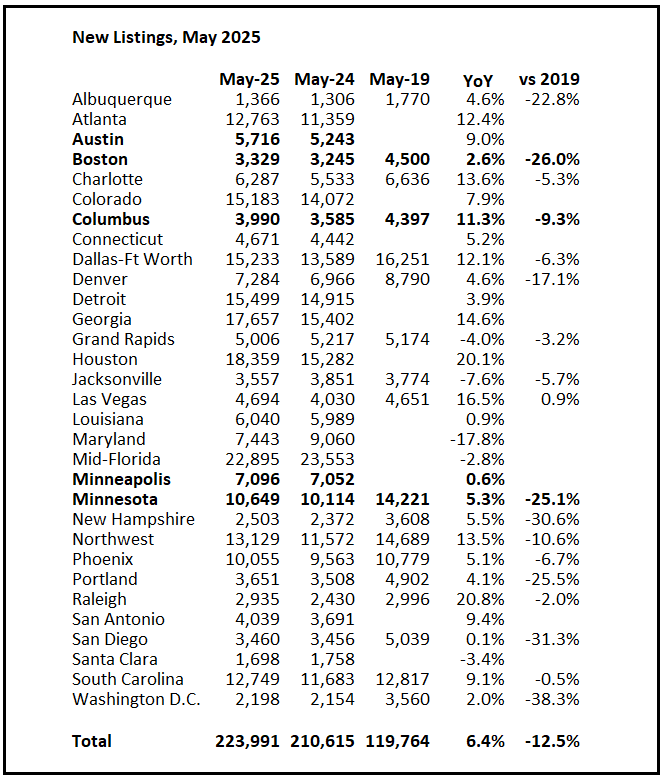
New Listings in May
For these areas, new listings were up 6.4% year-over-year.
Last month, new listings in these markets were up 9.9% year-over-year.
New listings are now up year-over-year, but down 12.5% compared to May 2019 activity for the cities that I have 2019 data.
Active Inventory in May
Inventory was up 28.1% year-over-year. Last month inventory in these markets was up 30.8% YoY. Inventory is picking up more than usual in the Spring.
Note the significant regional differences.
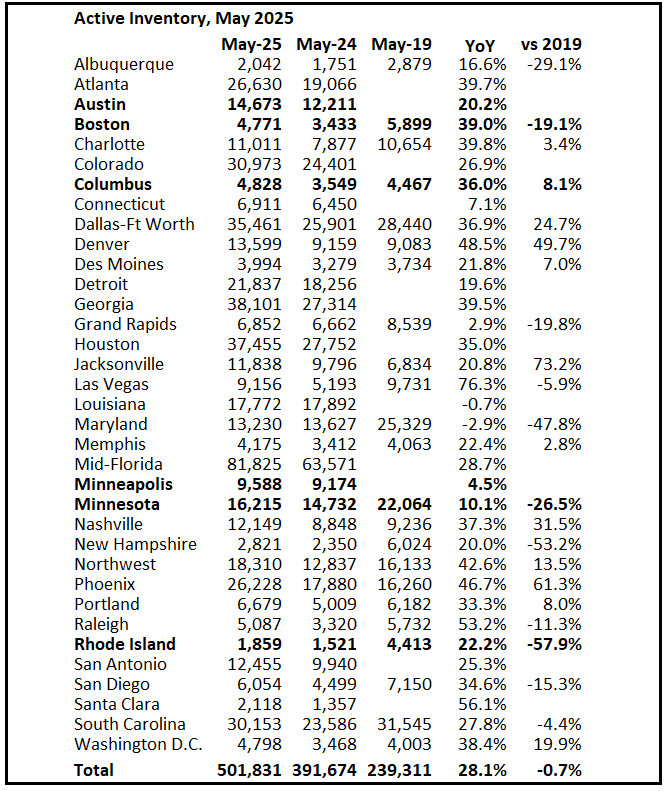
Several local markets - like Illinois, Miami, New Jersey and New York - will report after the NAR release.