


Case-Shiller: National House Price Index Up 3.4% year-over-year in March
FHFA House Prices up 3.7% YoY in March

S&P/Case-Shiller released the monthly Home Price Indices for March ("March" is a 3-month average of January, February and March closing prices). January closing prices include some contracts signed in November, so there is a significant lag to this data. Here is a graph of the month-over-month (MoM) change in the Case-Shiller National Index Seasonally Adjusted (SA).

The MoM decrease in the seasonally adjusted (SA) Case-Shiller National Index was at -0.30% (a -3.5% annual rate), This was the first MoM decrease since January 2023.
On a seasonally adjusted basis, prices increased month-to-month in just 6 of the 20 Case-Shiller cities. San Francisco has fallen 6.3% from the recent peak, Tampa is down 2.6% from the peak, and Denver down 1.9%.
FHFA House Price Index
On the FHFA index: U.S. House Prices Rise 4.0 Percent over the Prior Year; Up 0.7 Percent from the Fourth Quarter of 2024
U.S. house prices rose 4.0 percent between the first quarter of 2024 and the first quarter of 2025, according to the U.S. Federal Housing (FHFA) House Price Index (FHFA HPI®). House prices for the first quarter of 2025 were up 0.7 percent compared to the fourth quarter of 2024. FHFA’s seasonally adjusted monthly index for March was down 0.1 percent from February.
emphasis added
Note that the FHFA is reporting Q1 2025 over Q1 2024. The index increased 3.7% YoY in March as shown in the following graph.
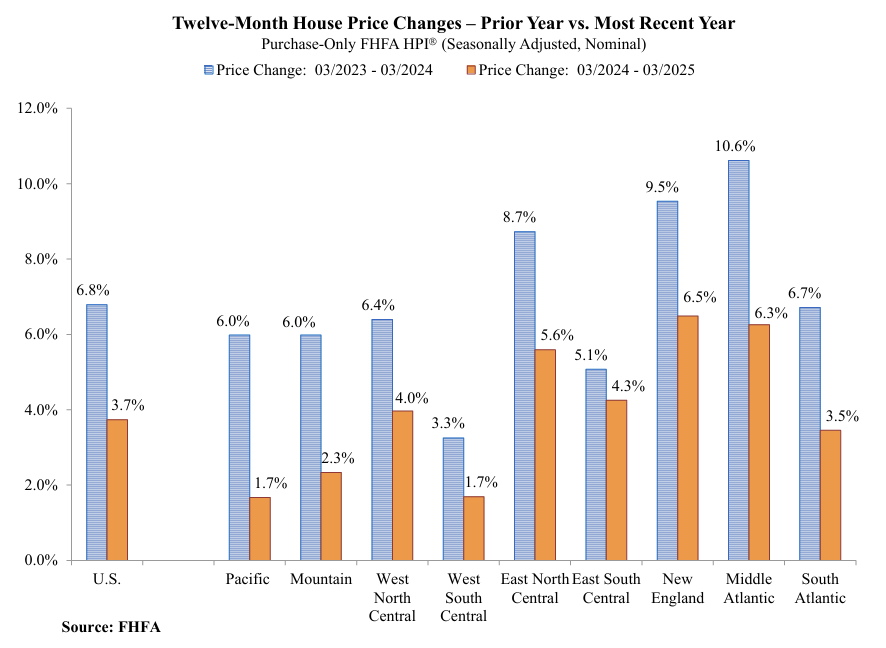
Here is a graph from the FHFA report showing the annual change by region for March 2025 compared to March 2024. Prices have increased year-over-year in all regions. Note that the YoY increase is smaller this year, compared to the YoY increase in March 2024 in all of the nine regions.
Case-Shiller House Prices
From S&P S&P CoreLogic Case-Shiller Index Records 3.4% Annual Gain in March 2025
The S&P CoreLogic Case-Shiller U.S. National Home Price NSA Index, covering all nine U.S. census divisions, reported a 3.4% annual return for March, down from a 4% annual gain in the previous month. The 10-City Composite saw an annual increase of 4.8%, down from a 5.2% annual increase in the previous month. The 20-City Composite posted a year-over-year increase of 4.1%, down from a 4.5% increase in the previous month. New York again reported the highest annual gain among the 20 cities with an 8% increase in March, followed by Chicago and Cleveland with annual increases of 6.5% and 5.9%, respectively. Tampa posted the lowest return, falling 2.2%.
...
The pre-seasonally adjusted U.S. National, 10-City Composite, and 20-City Composite Indices saw slight upward trends in March, posting gains of 0.8%, 1.2%, and 1.1%, respectively.
After seasonal adjustment, the U.S. National Index posted a decrease of -0.3%. The 10-City Composite Index recorded a 0.01% increase and the 20-City Composite Index presented a -0.1% decrease.
“Home price growth continued to decelerate on an annual basis in March, even as the market experienced its strongest monthly gains so far in 2025,” said Nicholas Godec, CFA, CAIA, CIPM, Head of Fixed Income Tradables & Commodities at S&P Dow Jones Indices. “This divergence between slowing year-over-year appreciation and renewed spring momentum highlighted how the housing market shifted from mere resilience to a broader seasonal recovery. Limited supply and steady demand drove prices higher across most metropolitan areas, despite affordability challenges remaining firmly in place."
emphasis added
This graph shows the nominal seasonally adjusted Composite 10, Composite 20 and National indices (the Composite 20 was started in January 2000).

The Composite 10 index was up 0.01% in March (SA). The Composite 20 index was down 0.1% (SA) in March. The National index was down 0.3% (SA) in March.

The Composite 10 NSA was up 4.8% year-over-year. The Composite 20 NSA was up 4.1% year-over-year. The National index NSA was up 3.4% year-over-year.
And a few things to watch …
The following content is for paid subscribers only. Thanks to all paid subscribers!
Keep reading with a 7-day free trial
Subscribe to CalculatedRisk Newsletter to keep reading this post and get 7 days of free access to the full post archives.