Case-Shiller: National House Price Index Up 3.6% year-over-year in October
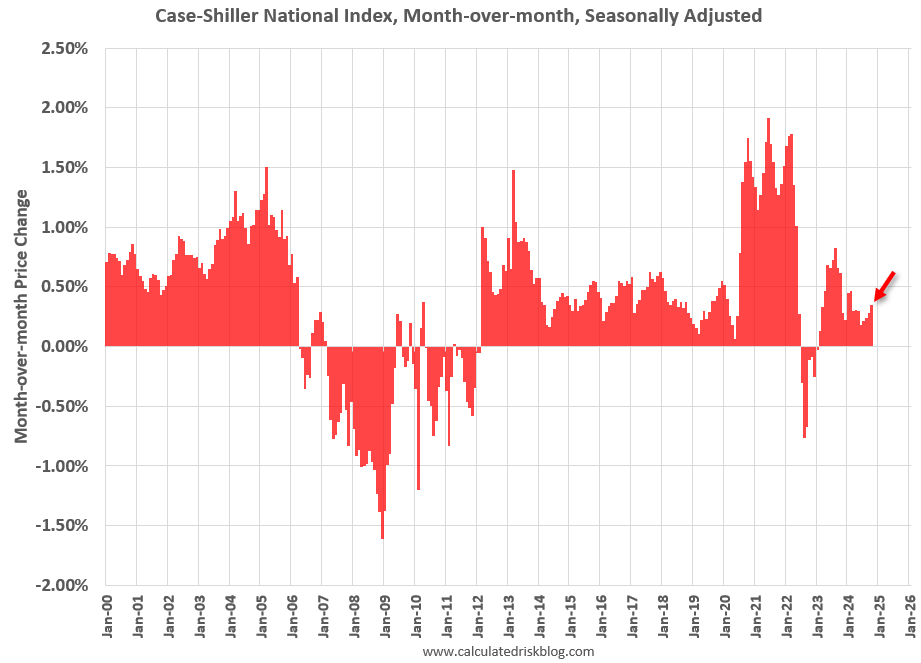
S&P/Case-Shiller released the monthly Home Price Indices for October ("October" is a 3-month average of August, September and October closing prices). October closing prices include some contracts signed in June, so there is a significant lag to this data. Here is a graph of the month-over-month (MoM) change in the Case-Shiller National Index Seasonally Adjusted (SA).
The MoM increase in the seasonally adjusted (SA) Case-Shiller National Index was at 0.35% (a 4.2% annual rate), This was the 21st consecutive MoM increase in the seasonally adjusted index.
On a seasonally adjusted basis, prices increased month-to-month in 18 of the 20 Case-Shiller cities (prices declined in Cleveland and Tampa seasonally adjusted). San Francisco has fallen 6.4% from the recent peak, Phoenix is down 3.0% from the peak, and Denver down 2.0%.
FHFA House Price Index
On the FHFA index: FHFA House Prices Rise 0.4 Percent in October; Up 4.5 Percent from a Year Earlier
U.S. house prices rose 0.4 percent in October, according to the Federal Housing Finance Agency’s (FHFA) seasonally adjusted monthly House Price Index (HPI®). House prices rose 4.5 percent from October 2023 to October 2024. The previously reported 0.7 percent price growth in September remained unchanged.
“Annual house price gains have been trending down since February, stabilizing around 4.5 percent during the last three months,” said Dr. Anju Vajja, Deputy Director for FHFA’s Division of Research and Statistics. “Even with elevated house prices and mortgage rates putting continued pressure on affordability, house prices continued to grow at a steady rate, likely due to a historically low inventory of homes for sale.”
emphasis added
The seasonally adjusted monthly index increased 0.4% in October. Here is a graph from the FHFA report showing the annual change by region for October 2024 compared to October 2023. Prices have increased year-over-year everywhere. Note that the YoY increase is smaller this year, compared to the YoY increase in October 2023 in eight of the nine regions.
Case-Shiller House Prices
From S&P S&P CoreLogic Case-Shiller Index Records 3.6% Annual Gain in October 2024
The S&P CoreLogic Case-Shiller U.S. National Home Price NSA Index, covering all nine U.S. census divisions, reported a 3.6% annual return for October, down from a 3.9% annual gain in the previous month. The 10-City Composite saw an annual increase of 4.8%, down from a 5.2% annual increase in the previous month. The 20-City Composite posted a year-over-year increase of 4.2%, dropping from a 4.6% increase in the previous month. New York again reported the highest annual gain among the 20 cities with a 7.3% increase in October, followed by Chicago and Las Vegas with annual increases of 6.2% and 5.9%, respectively. Tampa posted the smallest year-over-year growth with 0.4%
...
The pre-seasonally adjusted U.S. National Index, 20-City Composite, and 10-City Composite upward trends continued to reverse in October, with a -0.2% drop for the national index, and the 20-City and 10-City Composites saw -0.2% and -0.1% returns for this month, respectively.
After seasonal adjustment, the U.S. National Index posted a month-over-month increase of 0.3%, while both the 20-City and 10-City Composite reported monthly rises of 0.3%.
“New York once again reigns supreme as the fastest-growing housing market with annual returns over double the national average,” says Brian D. Luke, CFA, Head of Commodities, Real & Digital Assets. “Two markets have dominated the top ranks with New York leading all markets the past six months and San Diego the six months prior. New York is the only market sitting at all-time highs and one of just three markets with gains on the month. Accounting for seasonal adjustments shows a broader rally across the country.
“Our National Index hit its 17th consecutive all-time high, and only two markets – Tampa and Cleveland – fell during the past month,” Luke continued. “The annual returns continue to post positive inflation-adjusted returns but are falling well short of the annualized gains experienced this decade. Markets in Florida and Arizona are rising, but not keeping up with inflation, and are well off the over 10% gains annually from 2020 to present. This has allowed other markets to catch up.
“With the latest data covering the period prior to the election, our national index has shown continued improvement,” Luke continued. “Removing the political uncertainly risk has led to an equity market rally; it will be telling should the similar sentiment occur among homeowners.”
emphasis added
This graph shows the nominal seasonally adjusted Composite 10, Composite 20 and National indices (the Composite 20 was started in January 2000).
The Composite 10 index was up 0.3% in October (SA). The Composite 20 index was up 0.3% (SA) in October. The National index was up 0.3% (SA) in October.
The Composite 10 SA was up 4.8% year-over-year. The Composite 20 SA was up 4.2% year-over-year. The National index SA was up 3.6% year-over-year.
And a few things to watch …
The following content is for paid subscribers only. Thanks to all paid subscribers!
Keep reading with a 7-day free trial
Subscribe to CalculatedRisk Newsletter to keep reading this post and get 7 days of free access to the full post archives.


