


Case-Shiller: National House Price Index Up 2.7% year-over-year in April
FHFA House Prices up 3.0% YoY in April

S&P/Case-Shiller released the monthly Home Price Indices for April ("April" is a 3-month average of February, March and April closing prices). February closing prices include some contracts signed in December, so there is a significant lag to this data. Here is a graph of the month-over-month (MoM) change in the Case-Shiller National Index Seasonally Adjusted (SA).

The MoM decrease in the seasonally adjusted (SA) Case-Shiller National Index was at -0.51% (a -4.8% annual rate). This was the second consecutive MoM decrease.
On a seasonally adjusted basis, prices increased month-to-month in just 5 of the 20 Case-Shiller cities. San Francisco has fallen 6.4% from the recent peak, Tampa is down 2.7% from the peak, and Denver down 2.0%.
FHFA House Price Index Declined 0.4% in April
On the FHFA index: FHFA House Price Index® Down 0.4 Percent in April; Up 3.0 Percent from Last Year
U.S. house prices fell 0.4 percent in April, according to the U.S. Federal Housing (FHFA) seasonally adjusted monthly House Price Index (FHFA HPI®). House prices rose 3.0 percent from April 2024 to April 2025. The previously reported 0.1 percent price decline in March was revised upward to 0.0 percent.
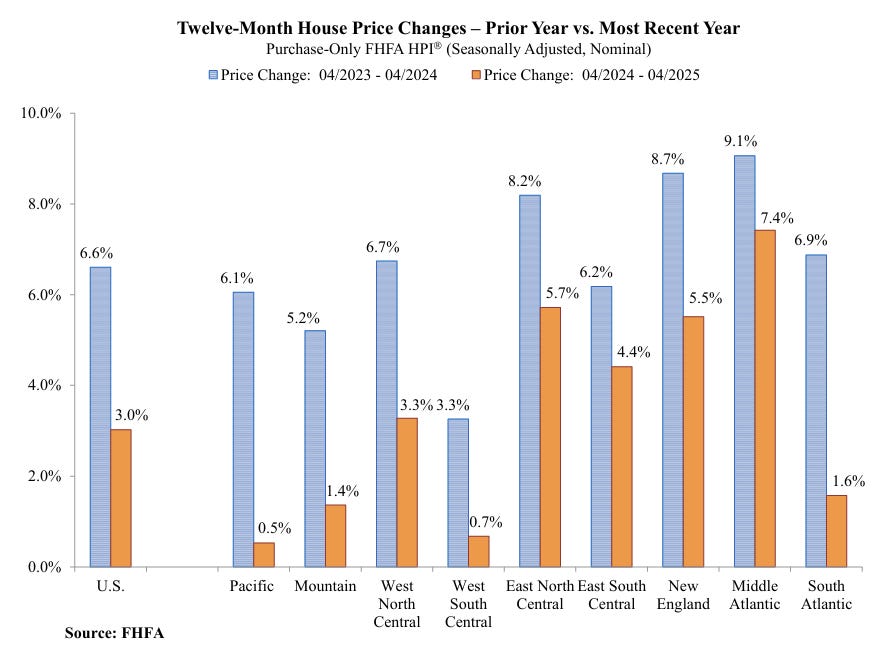
For the nine census divisions, seasonally adjusted monthly home price changes ranged from -1.3 percent in the West South Central and South Atlantic divisions to +1.2 percent in the Middle Atlantic division. The 12-month changes were all positive, ranging from +0.5 percent in the Pacific division to +7.4 percent in the Middle Atlantic division.
emphasis added
Here is a graph from the FHFA report showing the annual change by region for April 2025 compared to April 2024. Prices have increased year-over-year in all regions. Note that the YoY increase is smaller this year, compared to the YoY increase in April 2024 in all of the nine regions.
We will likely see regional YoY price declines soon in the FHFA data.
Case-Shiller House Prices
From S&P S&P CoreLogic Case-Shiller Index Records 2.7% Annual Gain in April 2025
The S&P CoreLogic Case-Shiller U.S. National Home Price NSA Index, covering all nine U.S. census divisions, reported a 2.7% annual return for April, down from a 3.4% annual gain in the previous month. The 10-City Composite saw an annual increase of 4.1%, down from a 4.8% annual increase in the previous month. The 20-City Composite posted a year-over-year increase of 3.4%, down from a 4.1% increase in the previous month. New York again reported the highest annual gain among the 20 cities with a 7.9% increase in April, followed by Chicago and Detroit with annual increases of 6.0% and 5.5%, respectively. Tampa posted the lowest return, falling 2.2%.
...
The pre-seasonally adjusted U.S. National Index saw slight upward trends in April, posting gains of 0.6%. The 10-City Composite and 20-City Composite Indices both reported gains of 0.7%.
After seasonal adjustment, the U.S. National Index posted a decrease of -0.4%. Both the 10-City Composite and the 20-City Composite Indices saw a -0.3% decrease.
“The housing market continued its gradual deceleration in April, with annual price gains slowing to their most modest pace in nearly two years,” said Nicholas Godec, CFA, CAIA, CIPM, Head of Fixed Income Tradables & Commodities at S&P Dow Jones Indices. “What's particularly striking is how this cycle has reshuffled regional leadership—markets that were pandemic darlings are now lagging, while historically steady performers in the Midwest and Northeast are setting the pace. This rotation signals a maturing market that's increasingly driven by fundamentals rather than speculative fervor.
“The National Composite Index posted a 2.7% annual gain in April, marking its slowest year-over-year appreciation since mid-2023. This deceleration was broad-based, with the 20-City Composite advancing 3.4% and the 10-City Composite up 4.1%—both substantially below their recent peaks. The composition of these gains tells an important story: Approximately 1.7 percentage points of April's annual increase occurred over the past six months, indicating that price momentum has been concentrated in the recent spring selling season rather than sustained throughout the year. "
emphasis added
This graph shows the nominal seasonally adjusted Composite 10, Composite 20 and National indices (the Composite 20 was started in January 2000).

The Composite 10 index was down 0.3% in April (SA). The Composite 20 index was down 0.3% (SA) in April. The National index was down 0.4% (SA) in April.

The Composite 10 NSA was up 4.1% year-over-year. The Composite 20 NSA was up 3.4% year-over-year. The National index NSA was up 2.7% year-over-year.
And a few things to watch …
The following content is for paid subscribers only. Thanks to all paid subscribers!
Keep reading with a 7-day free trial
Subscribe to CalculatedRisk Newsletter to keep reading this post and get 7 days of free access to the full post archives.