


Case-Shiller: National House Price Index Up 3.9% year-over-year in December

S&P/Case-Shiller released the monthly Home Price Indices for December ("December" is a 3-month average of October, November and December closing prices). December closing prices include some contracts signed in August, so there is a significant lag to this data. Here is a graph of the month-over-month (MoM) change in the Case-Shiller National Index Seasonally Adjusted (SA).

The MoM increase in the seasonally adjusted (SA) Case-Shiller National Index was at 0.46% (a 5.7% annual rate), This was the 23rd consecutive MoM increase in the seasonally adjusted index.
On a seasonally adjusted basis, prices increased month-to-month in 18 of the 20 Case-Shiller cities (prices declined in Washington, D.C. and Tampa seasonally adjusted). San Francisco has fallen 5.7% from the recent peak, Phoenix is down 1.2% from the peak, and Tampa down 1.2%.
FHFA House Price Index
On the FHFA index: U.S. House Prices Rise 4.5 Percent over the Prior Year; Up 1.4 Percent from the Third Quarter of 2024
U.S. house prices rose 4.5 percent between the fourth quarter of 2023 and the fourth quarter of 2024, according to the Federal Housing Finance Agency (FHFA) House Price Index (FHFA HPI®). House prices were up 1.4 percent compared to the third quarter of 2024. FHFA’s seasonally adjusted monthly index for December was up 0.4 percent from November.
“U.S. house prices grew at a slightly higher rate in the fourth quarter after three straight previous quarters of weaker appreciation,” said Dr. Anju Vajja, Deputy Director for FHFA’s Division of Research and Statistics. “The price growth accelerated during the quarter as the inventory of homes for sale tightened even further.”
“Annual house price gains continued to moderate in November, with sales prices in all nine Census divisions exhibiting slower pace of growth than a year earlier,” said Dr. Anju Vajja, Deputy Director for FHFA’s Division of Research and Statistics. “The slowdown in price growth is likely due to higher mortgage rates contributing to cooling demand.”
emphasis added
Here is a graph from the FHFA report showing the annual change by region for December 2024 compared to December 2023. Prices have increased year-over-year in all regions. Note that the YoY increase is smaller this year, compared to the YoY increase in December 2023 in all of the nine regions.

Case-Shiller House Prices
From S&P S&P CoreLogic Case-Shiller Index Records 3.9% Annual Gain in December 2024
The S&P CoreLogic Case-Shiller U.S. National Home Price NSA Index, covering all nine U.S. census divisions, reported a 3.9% annual return for December, up from a 3.7% annual gain in the previous month. The 10-City Composite saw an annual increase of 5.1%, up from a 5% annual increase in the previous month. The 20-City Composite posted a year-over-year increase of 4.5%, up from a 4.3% increase in the previous month. New York again reported the highest annual gain among the 20 cities with a 7.2% increase in December, followed by Chicago and Boston with annual increases of 6.6% and 6.3%, respectively. Tampa posted the lowest return, falling 1.1%.
...
The pre-seasonally adjusted U.S. National and 20-City Composite Indices’ upward trends continued to reverse in December, with both posting a -0.1% drop. The 10-City Composite’s monthly return dropped 0.04%.
After seasonal adjustment, the U.S. National, 20-City, and 10-City Composite Indices all posted a month-over-month increase of 0.5%.
“It has been five years since the Covid-19 outbreak took hold of the global economy, sparking unprecedented volatility, massive fiscal and monetary stimulus, and a housing market that responded to national migratory changes in how we work and where we live,” says Brian D. Luke, CFA, Head of Commodities, Real & Digital Assets at S&P Dow Jones Indices. “National home prices have risen by 8.8% annually since 2020, led by markets in Florida, North Carolina, Southern California, and Arizona. While our National Index continues to trend above inflation, we are a few years removed from peak home price appreciation of 18.9% observed in 2021 and are seeing below-trend growth over the history of the index.
“Home prices stalled during the second half of the year with markets in the West dropping the fastest. San Francisco, the worst performing market since 2020, dropped 4.5% during the last six months of the year, followed by Seattle with a 3.0% decline. San Francisco is now 11.0% lower than its post-pandemic peak reached in May 2022. Previous strongholds like San Diego and Tampa experienced declines of 2.9% and 2.7%, respectively, during the second half of the year. After accounting for seasonal adjustments, our National Index pushed forward to achieve a 19th consecutive all-time high,” Luke continued. “The longest such streak occurred for over 12-years, notching 153 consecutive all-time highs from July 1993 to March 2006.
“The Northeast continues to lead all regions with above-trend growth, led by New York for the eighth consecutive time. Boston reached an all-time high, the only market to do so for the period ended December 2024."
emphasis added
This graph shows the nominal seasonally adjusted Composite 10, Composite 20 and National indices (the Composite 20 was started in January 2000).
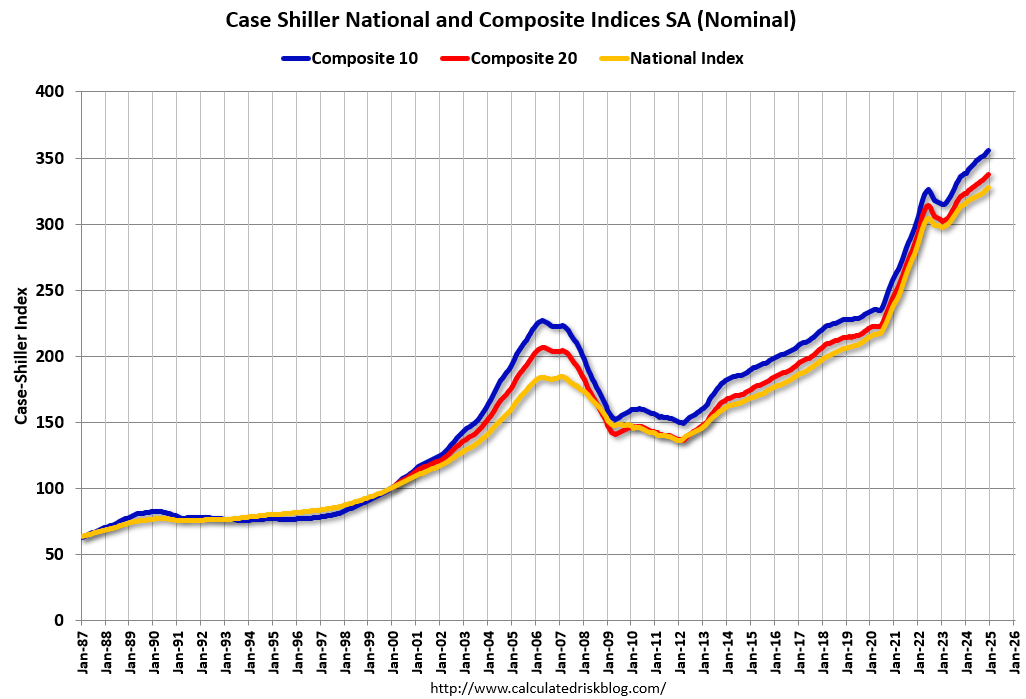
The Composite 10 index was up 0.5% in December (SA). The Composite 20 index was up 0.5% (SA) in December. The National index was up 0.5% (SA) in December.
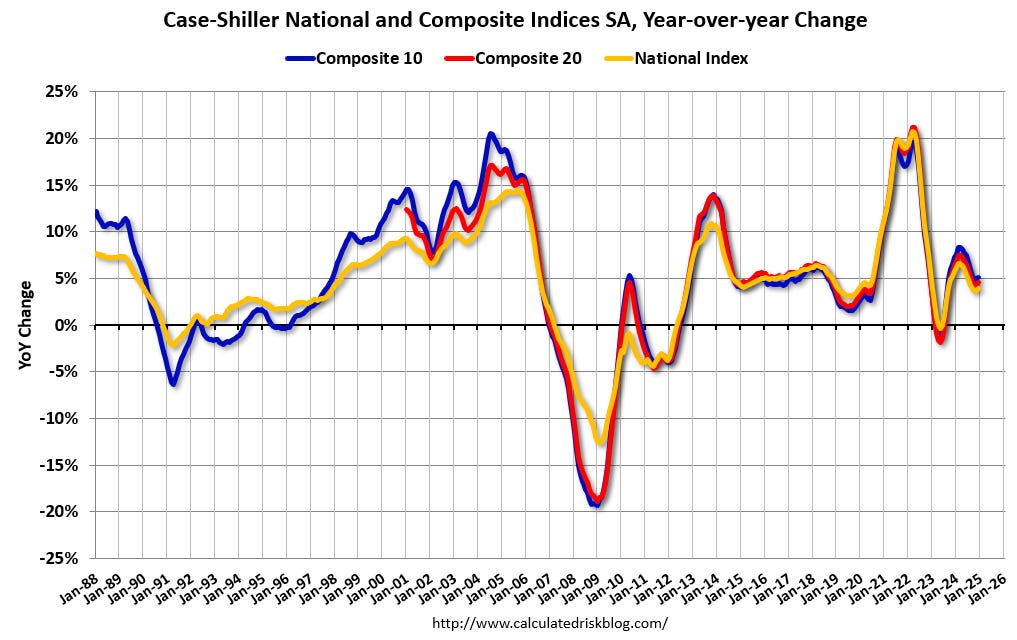
The Composite 10 NSA was up 5.1% year-over-year. The Composite 20 NSA was up 4.5% year-over-year. The National index NSA was up 3.9% year-over-year.
And a few things to watch …
The following content is for paid subscribers only. Thanks to all paid subscribers!
Keep reading with a 7-day free trial
Subscribe to CalculatedRisk Newsletter to keep reading this post and get 7 days of free access to the full post archives.