

Discover more from CalculatedRisk Newsletter
Case-Shiller National Index up 19.2% Year-over-year in January
FHFA: "House prices continued to climb but not as rapidly during the final quarter of 2021 as in earlier quarters"
Both the Case-Shiller House Price Index (HPI) and the Federal Housing Finance Agency (FHFA) HPI for January were released today. Here is a graph of the month-over-month (MoM) change in the Case-Shiller National Index Seasonally Adjusted (SA).
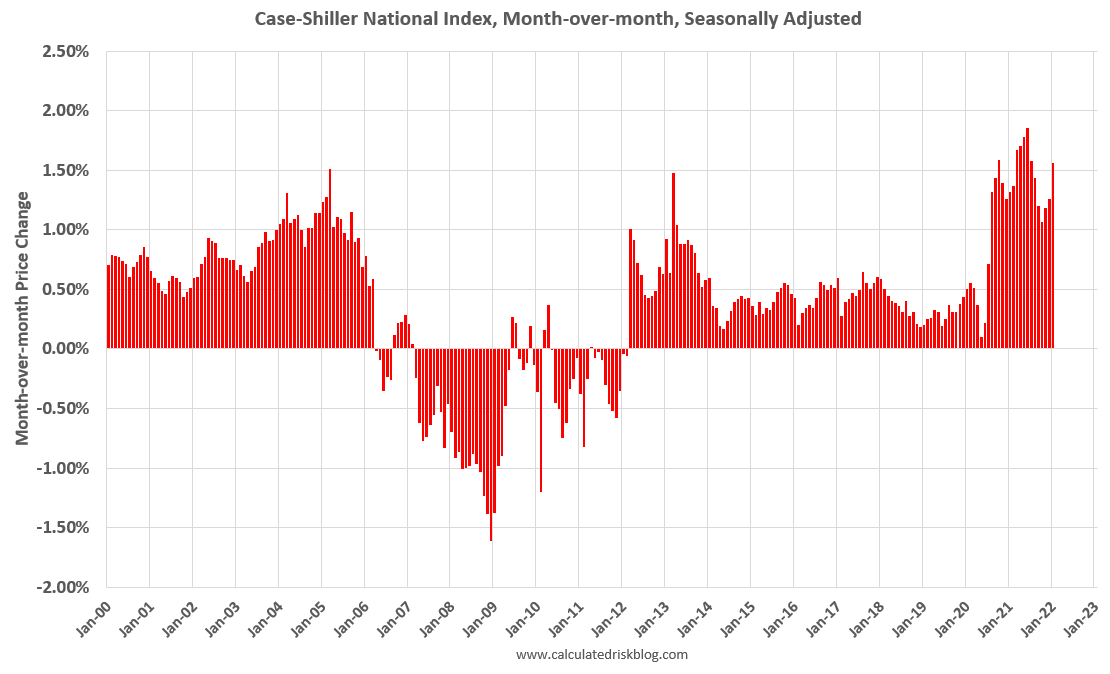
The MoM increase in Case-Shiller was at 1.56%. This is the seventh strongest MoM increase in the Case-Shiller index (since 1975), and stronger than any month during the housing bubble or during the late ‘70s with high inflation. Still, the peak MoM growth is behind us, although price growth did accelerate in January.
FHFA House Price Index
On the FHFA index: U.S. House Prices Rise 17.5 Percent over the Last Year; Up 3.3 Percent from the Third Quarter
House prices rose nationwide in January, up 1.6 percent from the previous month, according to the latest Federal Housing Finance Agency House Price Index (FHFA HPI®). House prices rose 18.2 percent from January 2021 to January 2022. The previously reported 1.2 percent price change for December 2021 was revised upward to a 1.3 percent price change. …
House price trends notched up slightly in January,” said Will Doerner, Ph.D., Supervisory Economist in FHFA’s Division of Research and Statistics. “Rising mortgage rates in January certainly reflect a major change from the past several years, but lending costs remain relatively low. The mortgage rate shift has not dampened upward price pressure from intense borrower demand and limited supply.”
emphasis added
This is the monthly and quarterly indexes. Here is a graph from the FHFA report showing the annual change by region for January 2022 compared to January 2021. Prices have increased sharply everywhere, but especially in the Mountain, South Atlantic, East South Central and Pacific regions.
Case-Shiller House Prices
From S&P: S&P Corelogic Case-Shiller Index Reports 19.2% Annual Home Price Gain to Start 2022
The S&P CoreLogic Case-Shiller U.S. National Home Price NSA Index, covering all nine U.S. census divisions, reported a 19.2% annual gain in January, up from 18.9% in the previous month. The 10-City Composite annual increase came in at 17.5%, up from 17.1% in the previous month. The 20-City Composite posted a 19.1% year-over-year gain, up from 18.6% in the previous month. …
“Home price changes in January 2022 continued the strength we had observed for much of the prior year,” says Craig J. Lazzara, Managing Director at S&P DJI. “The National Composite Index recorded a gain of 19.2% for the 12 months ended in January 2022; the 10- and 20-City Composites rose 17.5% and 19.1%, respectively. All three composites reflect a small acceleration of price growth for January 2022.“Last fall we observed that home prices, although continuing to rise quite sharply, had begun to decelerate. Even that modest deceleration was on pause in January. The 19.2% year-over-year change for January was the fourth-largest reading in 35 years of history.”
emphasis added
This graph shows the nominal seasonally adjusted Composite 10, Composite 20 and National indices (the Composite 20 was started in January 2000).
The Composite 10 index is up 1.4% in January (SA). The Composite 20 index is up 1.4% (SA) in January. The National index is 54% above the bubble peak (SA), and up 1.1% (SA) in January. The National index is up 108% from the post-bubble low set in February 2012 (SA).
The Composite 10 SA is up 17.5% year-over-year. The Composite 20 SA is up 19.1% year-over-year. The National index SA is up 19.2% year-over-year.
House Prices and Inventory
This graph below shows existing home months-of-supply (inverted, from the NAR) vs. the seasonally adjusted month-to-month price change in the Case-Shiller National Index (both since January 1999 through January 2022).
Note that the months-of-supply is not seasonally adjusted.
There is a clear relationship, and this is no surprise (but interesting to graph). If months-of-supply is high, prices decline. If months-of-supply is very low (like now), prices rise quickly.
In January, the months-of-supply was at 1.6 months, and the Case-Shiller National Index (SA) increased 1.56% month-over-month. The black arrow points to the January 2022 dot. In the February existing home sales report, the NAR reported months-of-supply increased to 1.7 months.
My sense is the Case-Shiller National annual growth rate of 19.98% in August was probably the peak YoY growth rate, however, since the normal level of inventory is probably in the 4 to 6 months range - we’d have to see a significant increase in inventory to sharply slow price increases, and that is why I’m focused on inventory!
Note: I’ll have more on real prices, price-to-rent and affordability tomorrow.
Please share with friends and colleagues, and please subscribe!