Discover more from CalculatedRisk Newsletter
There have been three recent key changes in the housing market:
New listings have declined significantly year-over-year.
This “Sellers’ Strike” has led to inventory growth stalling.
And homeowners have continued to borrow against their home equity, shifting from cash-out refinance to home equity loans (so they can keep their low interest 1st mortgage).
New Listing Have Declined
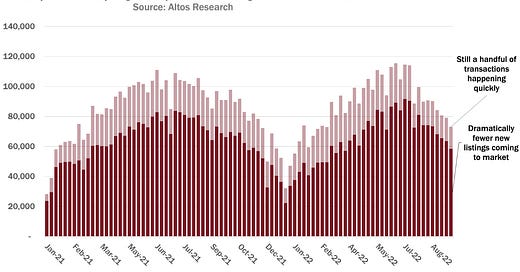
Mike Simonsen, CEO of Altos Research tweeted yesterday:
There's just a remarkable dearth of new listings.
25% fewer new listings each week than we'd expect for this time of year
The portion selling immediately (light red part of each bar here) is finally evaporating.
And here is a graph of new listing from Realtor.com’s August Housing Trends Report.
There are always some people that need to sell; death, divorce, moving for employment are a few reasons. However, homeowners with a low mortgage rate will be reluctant to sell, and then buy a new home, when their monthly payment will be much higher for the new home. This is probably the key reason new listings have declined sharply year-over-year.
This is a very different from the housing bust, when many homeowners were forced to sell as their teaser rates expired and they could not afford full the fully amortized mortgage payment. The current situation is similar to the 1980 period, when rates increased quickly. However, a key difference between now and in 1980 is that many loans were assumable in 1980 (a buyer could take over the existing loan). Currently FHA loans are assumable, but most loans are due-on-sale.
Impact on Inventory
In July, inventory was still low, but increasing quickly. However, the decline in new listings has led to inventory growth stalling recently.
Here is a graph from Realtor.com’s August Housing Trends Report.
The next graph uses the Altos inventory data through September 9th and shows the of the same week compared to 2019, 2020 and 2021. The blue line (compared to 2021) shows inventory is up YoY, but growth has stalled recently.
The red line compares to 2020, and it still seems likely inventory will be up compared to 2020 in Q4. The dashed purple line is compared to 2019, and this will be the key comparison for inventory.
For new homes, there are a record 7.3 months of homes under construction - well above the normal level (total inventory is at 10.9 months, but that includes homes not started). This elevated level of homes under construction is due to supply chain constraints. However, there are still very few completed homes for sale. This suggests we will see a sharp increase in completed inventory over the next several months - and that will put pressure on new home prices.
And for housing starts there are a near record 1.678 million units under construction.
House Prices
Reported house price growth is still strong, but the Case-Shiller National Index has started to show a deceleration to 18.0% in June. The recent slowdown will take some time to show up in the price indexes, see: When will House Price Growth Slow?
The above graph shows the YoY change for the three Case-Shiller indexes. The Case-Shiller index is a three-month average of closing prices, so “June” prices are for sales that closed in April, May and June. A few of those contracts were probably signed in February!
The next graph shows the MoM increase in the Case-Shiller index. This was at 0.33%. This was the smallest MoM increase since June 2020, and since this includes closings in April and May, this suggests price growth stalled in June.
And here is a graph comparing the YoY change in the NAR median prices vs the Case-Shiller National Index (the median is distorted by the mix of homes sold, and also lagged since this is for closing prices).
The YoY change in the median price peaked at 25.2% in May 2021 and slowed to 10.8% in July (still very strong increase in YoY prices).
In general, the NAR median price leads the Case-Shiller index by 2 to 3 months, so I expect the Case-Shiller index to show significantly slower YoY growth over the next several months.
However, a key question is will house prices decline if inventory stays low?
Sales
We are seeing declines in both new and existing home sales due to higher mortgage rates. The NAR reported sales in July were at “a seasonally adjusted annual rate of 4.81 million. Year-over-year, sales dropped 20.2% (from 6.03 million in July 2021).
The local market reports released so far suggest a similar year-over-year decline in closed sales in August.
And the Census Bureau reported “Sales of new single‐family houses in July 2022 were at a seasonally adjusted annual rate of 511,000”, down 29.6% from July 2021.
It is important to note that the Census Bureau reports gross sales, whereas the homebuilders report net sales (gross sales minus cancellations). Usually this isn’t a big difference, but during periods of rising cancellations, gross sales is too high. See: New Home Sales and Cancellations
Last week, Rick Palacios Jr., Director of Research at John Burns Real Estate Consulting tweeted that new home cancellation rates have increased sharply year-over-year.


Conclusions
We are seeing a significant year-over-year decline in the housing market, with more price reductions, and fewer sales. It will take some time to see the impact on house price growth, but that is coming too. However, inventory growth has stalled recently as new listings have declined year-over-year.
Next week, existing home sales will likely show another sharp year-over-year decline in sales for August - with sales solidly below 5 million SAAR again. Housing starts will probably show further declines (and still a near record number of homes under construction).
It is important to remember that housing is a key transmission mechanism for Federal Open Market Committee (FOMC) policy. As long as inflation remains elevated, the Fed will keep raising rates - and that will impact the housing market (although mortgage rates have already jumped in anticipation of the FOMC actions).
I’ll have much more on all of these topics.