From the NAR: Existing-Home Sales Continue Upward, Increasing 1.9% in November
Existing-home sales rose in November, denoting three consecutive months of increases, according to the National Association of Realtors®. Three of the four major U.S. regions reported growth in monthly sales, while the fourth region held steady in November. From a year-over-year perspective, only one region experienced a rise in sales as the three others saw home sales decline.
Total existing-home sales, completed transactions that include single-family homes, townhomes, condominiums and co-ops, grew 1.9% from October to a seasonally adjusted annual rate of 6.46 million in November. Sales fell 2.0% from a year ago (6.59 million in November 2020).
...
Total housing inventory at the end of November amounted to 1.11 million units, down 9.8% from October and down 13.3% from one year ago (1.28 million). Unsold inventory sits at a 2.1-month supply at the current sales pace, a decline from both the prior month and from one year ago.
emphasis added
The sales rate was above the consensus forecast, but as usual, housing economist Tom Lawler nailed it.
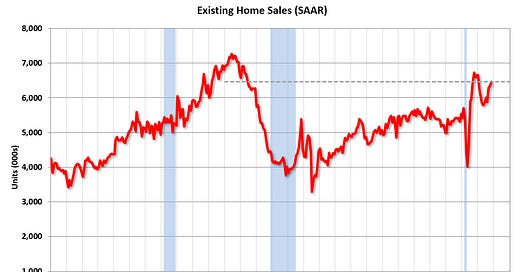
This graph shows existing home sales, on a Seasonally Adjusted Annual Rate (SAAR) basis since 1993.
Sales in November (6.46 million SAAR) were up 1.9% from last month and were 2.0% below the November 2020 sales rate.
Some of the increase in sales since the beginning of the pandemic was probably related to record low mortgage rates, strong second home buying, a strong stock market and favorable demographics.
The second graph shows existing home sales by month for 2020 and 2021.
This was the fourth consecutive month with sales down year-over-year. Sales will likely be down YoY in December and probably in January 2022 too since were exceptionally strong last Winter.
The third graph shows existing home sales for each month, Not Seasonally Adjusted (NSA), since 2005.
Sales NSA in November (503,000) were 2.0% below sales in November 2020 (493,000). Note that sales were up NSA, but down SA in November, due to one more selling day in November this year. This increase, NSA, is similar to the increase in the markets I track each month.
Sales NSA were the strongest for November since 2005!
Housing Inventory is Very Low
The fourth graph shows nationwide inventory for existing homes.
According to the NAR, inventory decreased to 1.11 million in November from 1.23 million in October. Inventory usually declines significantly in November and December as potential sellers remove their homes from the market for the holidays. Although inventory is still up from the lows earlier this year, inventory is still very low.
Headline inventory is not seasonally adjusted, and inventory usually decreases to the seasonal lows in December and January, and peaks in mid-to-late summer. The fifth graph shows the year-over-year (YoY) change in reported existing home inventory and months-of-supply. Since inventory is not seasonally adjusted, it really helps to look at the YoY change. Note: Months-of-supply is based on the seasonally adjusted sales and not seasonally adjusted inventory.
Inventory is very low and was down 13.3% year-over-year (YoY) in September. Also, as housing economist Tom Lawler has noted, the local MLS data shows even a larger decline in active inventory (the NAR appears to include some pending sales in inventory). Lawler noted:
"As I’ve noted before, the inventory measure in most publicly-released local realtor/MLS reports excludes listings with pending contracts, but that is not the case for many of the reports sent to the NAR (referred to as the “NAR Report!”), Since the middle of last Spring inventory measures excluding pending listings have fallen much more sharply than inventory measures including such listings, and this latter inventory measure understates the decline in the effective inventory of homes for sale over the last several months."
It seems likely that active inventory is down close to 28% year-over-year.
Months-of-supply at 2.1 months is very low, but still above the record low of 1.9 months set in December 2020 and January 2021. That record will be tested next month.
We will probably see inventory at a new record low over the Winter. Inventory is currently at 1.11 million (according to the NAR), and the record low was 1.03 million in January and February of 2021.
It is possible inventory will be up year-over-year sometime next year, but inventory will still be at very low levels.
Median House Price Growth Still Strong
On prices, the NAR reported:
The median existing-home price for all housing types in November was $353,900, up 13.9% from November 2020 ($310,800), as prices increased in each region, with the highest pace of appreciation in the South region. This marks 117 straight months of year-over-year increases, the longest-running streak on record.
Median prices are distorted by the mix (repeat sales indexes like Case-Shiller and FHFA are probably better for measuring prices).
The YoY change in the median price peaked at 23.6% in May and slowed to 12.7% in October (still very strong increase in prices). This deceleration will probably show up in Case-Shiller and the FHFA indexes very soon.
Finally, as usual, housing economist Tom Lawler's forecast was closer to the NAR report than the Consensus. The NAR reported 6.46 million SAAR, Lawler estimated the NAR would report 6.45 million SAAR, and the consensus was 6.20 million SAAR.
Please share with friends and colleagues, and please subscribe!