


Existing Homes: Some Regional Differences Appear
Final August Update for Local Housing Markets

The following data is important, especially active inventory and new listings. I’m looking to see if inventory will follow the normal seasonal pattern and decline into the winter, or if inventory will increase this year.
It is also interesting to see regional and local differences. For the last year, most housing markets moved together with rapidly falling inventory and sharply increasing house prices. However, in August, about half of these markets saw a month-over-month (MoM) increase in inventory - and the other half saw a decrease - so we might be seeing some regional divergence.
Only two markets saw a year-over-year (YoY) increase in inventory, but there were significant differences in the YoY change. Although the median YoY decrease was about 24%, several markets saw decreases of over 40%.
On a national basis, it is likely inventory will be up year-over-year sometime during the winter months, but inventory will still be at very low levels.
Final August Update: Columbus, Indiana, New York, and South Florida Added
I’m tracking about 30 local housing markets in the US. This is the final update for August. Some are states, and some are metropolitan areas. I’ll update this table throughout each month as additional data is released. This note adds Columbus, Indiana, New York, and South Florida.
Here is a summary of active listings for these housing markets in August. Inventory was down 1.3% in August MoM from July, and down 28.2% YoY.
The MoM decrease in inventory is similar to the NAR report, however the YoY decline is larger than the NAR reported, probably because the NAR includes some pending sales and this is for active inventory.
Notes: California just reports the MoM and YoY change. Denver is not included in the totals (included in Colorado). Additions are in BOLD in tables.

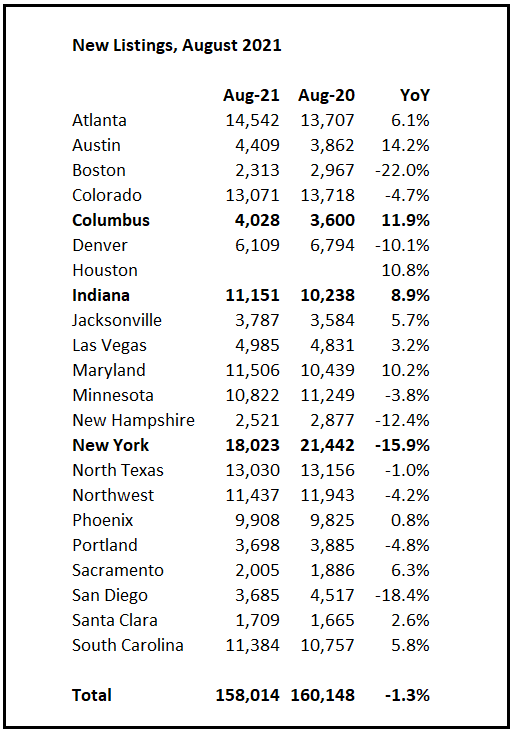
Please share with your friends and colleagues!And here is a table for new listings in August. New listing were down 1.3% YoY. However, not all areas report new listings, and Houston just reports the annual change. Given the size of the Houston market, a 10.9% annual increase in New Listings might make the change positive.
And a table of August sales. Sales were up 2.3% YoY, Not Seasonally Adjusted (NSA). The NAR reported sales NSA were up 2.9% from August 2020, so these local markets in aggregate are close.
Please subscribe for housing data and analysis.