

Here are two pieces of weekly data that show the impact of the recent increase in mortgage rates. Inventory is up and demand is down - and that will put pressure on house prices.
And two pieces of monthly data that show the housing slump has deepened.
MBA: Mortgage Applications Remain Weak
From the Mortgage Bankers Association: Mortgage Applications Decrease in Latest MBA Weekly Survey
Mortgage applications decreased 5.3 percent from one week earlier, according to data from the Mortgage Bankers Association’s (MBA) Weekly Mortgage Applications Survey for the week ending October 16, 2026.
The Market Composite Index, a measure of mortgage loan application volume, decreased 5.3 percent on a seasonally adjusted basis from one week earlier. On an unadjusted basis, the Index decreased 5 percent compared with the previous week. The Refinance Index decreased 2 percent from the previous week and was 59 percent lower than the same week one year ago. The seasonally adjusted Purchase Index decreased 7 percent from one week earlier. The unadjusted Purchase Index decreased 7 percent compared with the previous week and was 18 percent lower than the same week one year ago.
“Mortgage rates decreased for the first time in over two months, with the 30-year fixed rate dropping to 7.41 percent. However, lower rates were not enough to boost application activity, as both purchase and refinance applications continued to decline,” said Joel Kan, CMB, MBA’s Vice President and Deputy Chief Economist. “Purchase applications fell 18 percent behind last year’s pace, as higher rates are pricing buyers out of the market. The ARM share held steady at 10.5 percent, as ARM rates remained almost a full percentage point lower than the 30-year fixed rate, giving qualified borrowers a lower rate option to purchase a home.”
Added Kan, “It is very clear that the higher mortgage rate environment has cooled the housing market this fall.” emphasis added
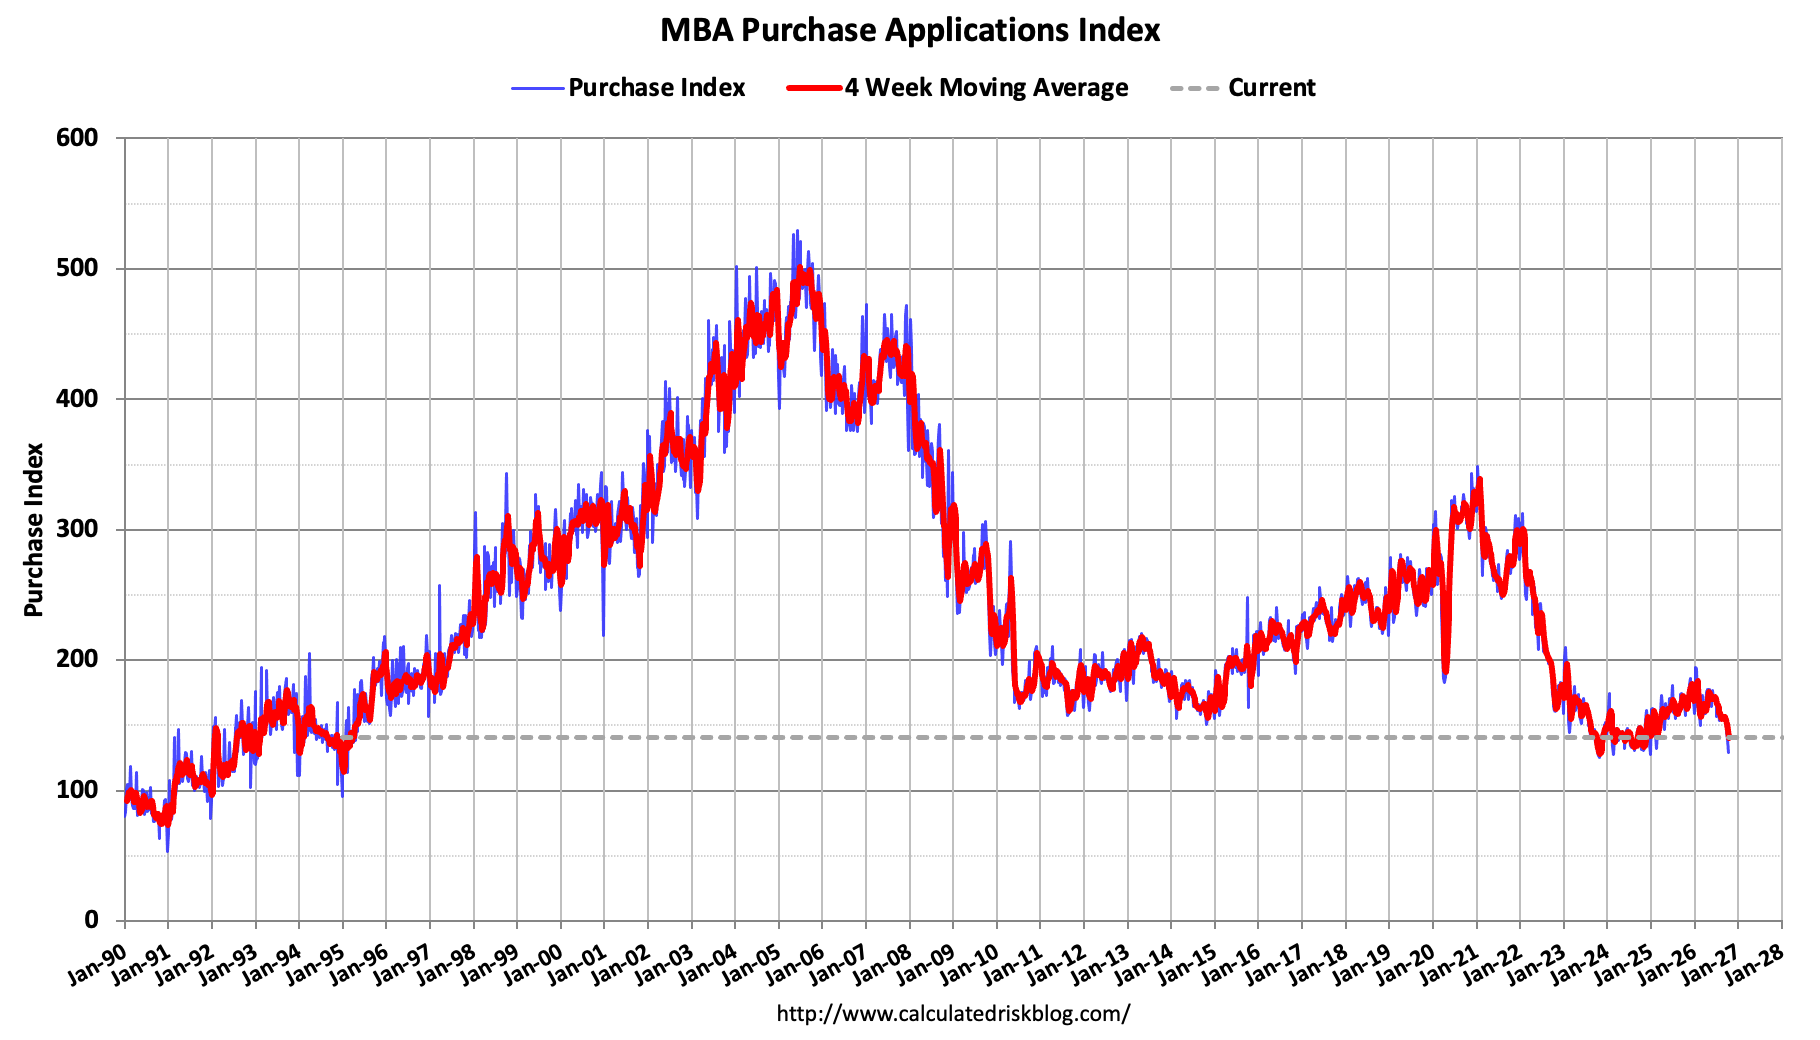
This graph shows the seasonally adjusted MBA mortgage purchase index. According to the MBA, purchase activity is down 18% year-over-year unadjusted.
Red is a four-week average (blue is weekly). Purchase application activity remains depressed.
The second graph shows the refinance index since 1990.
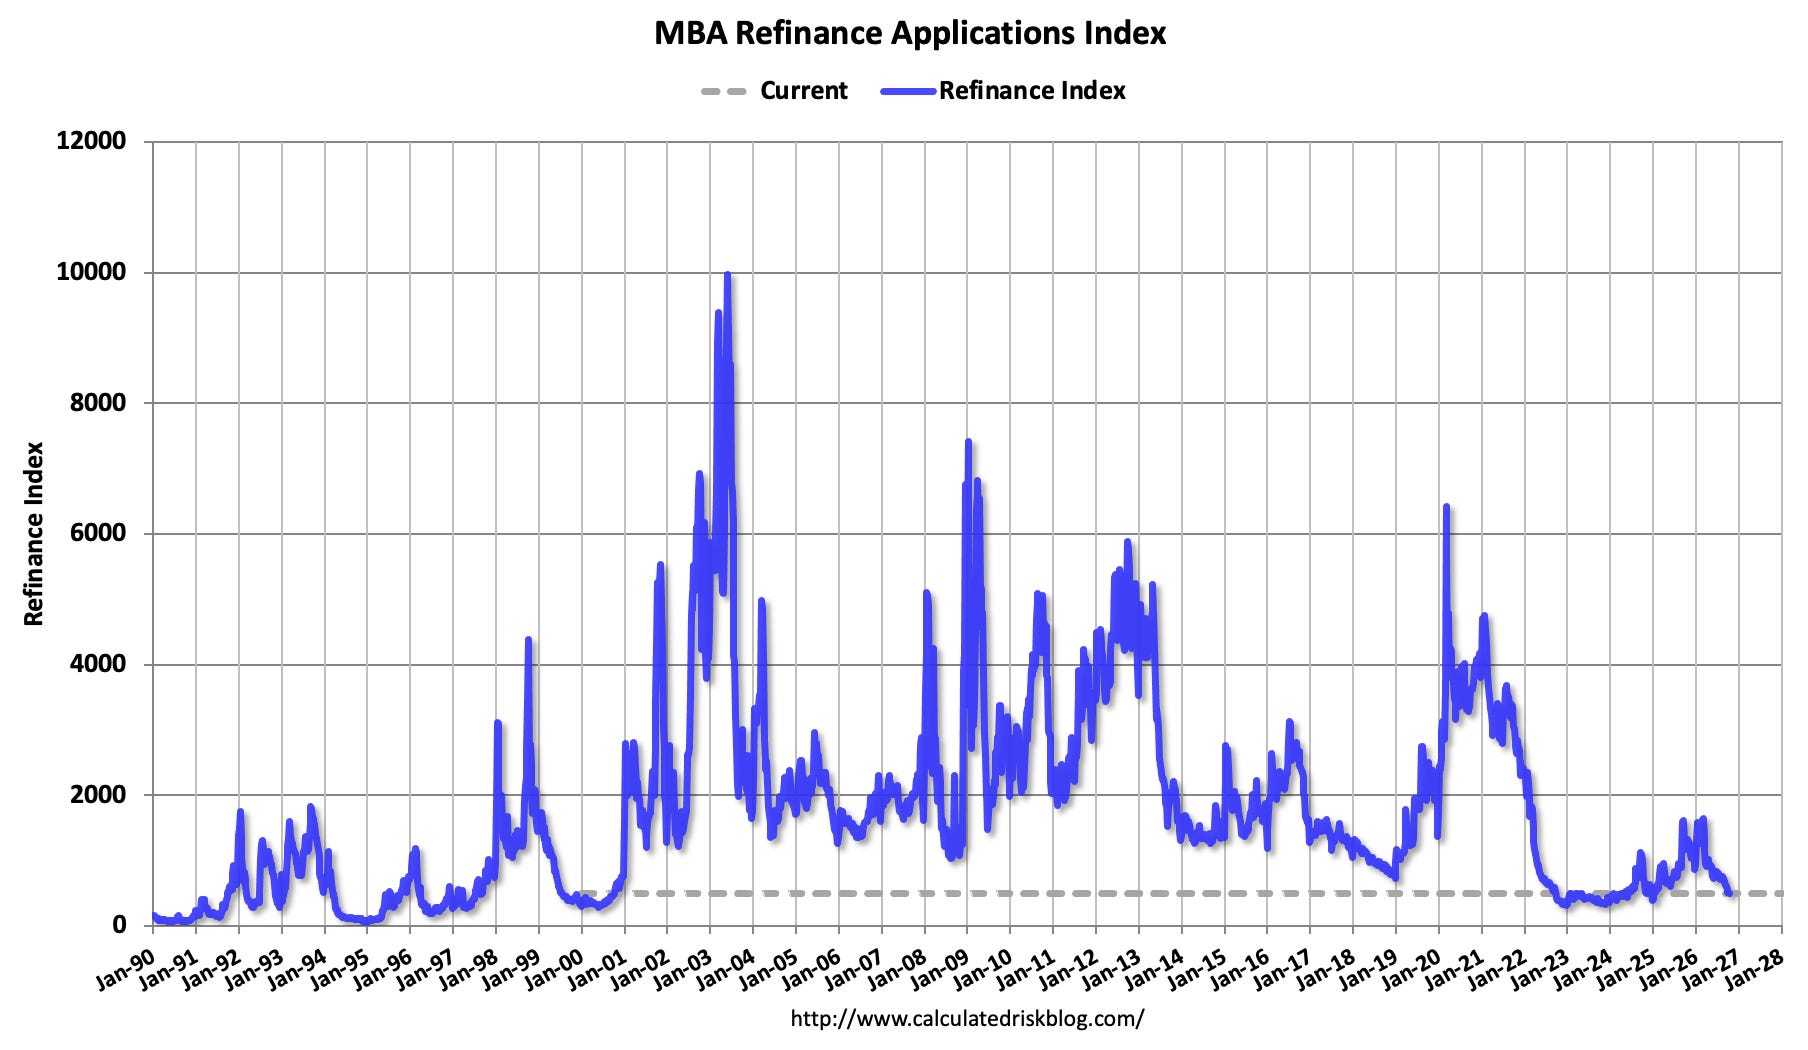
The refinance index is historically very low and has declined recently with the increase in mortgage rates.
Inventory Up Year-over-year
And here is some timely data from Altos Research on active single-family inventory. This graph shows the seasonal pattern for active single-family inventory since 2015 through last Friday (October 16th).
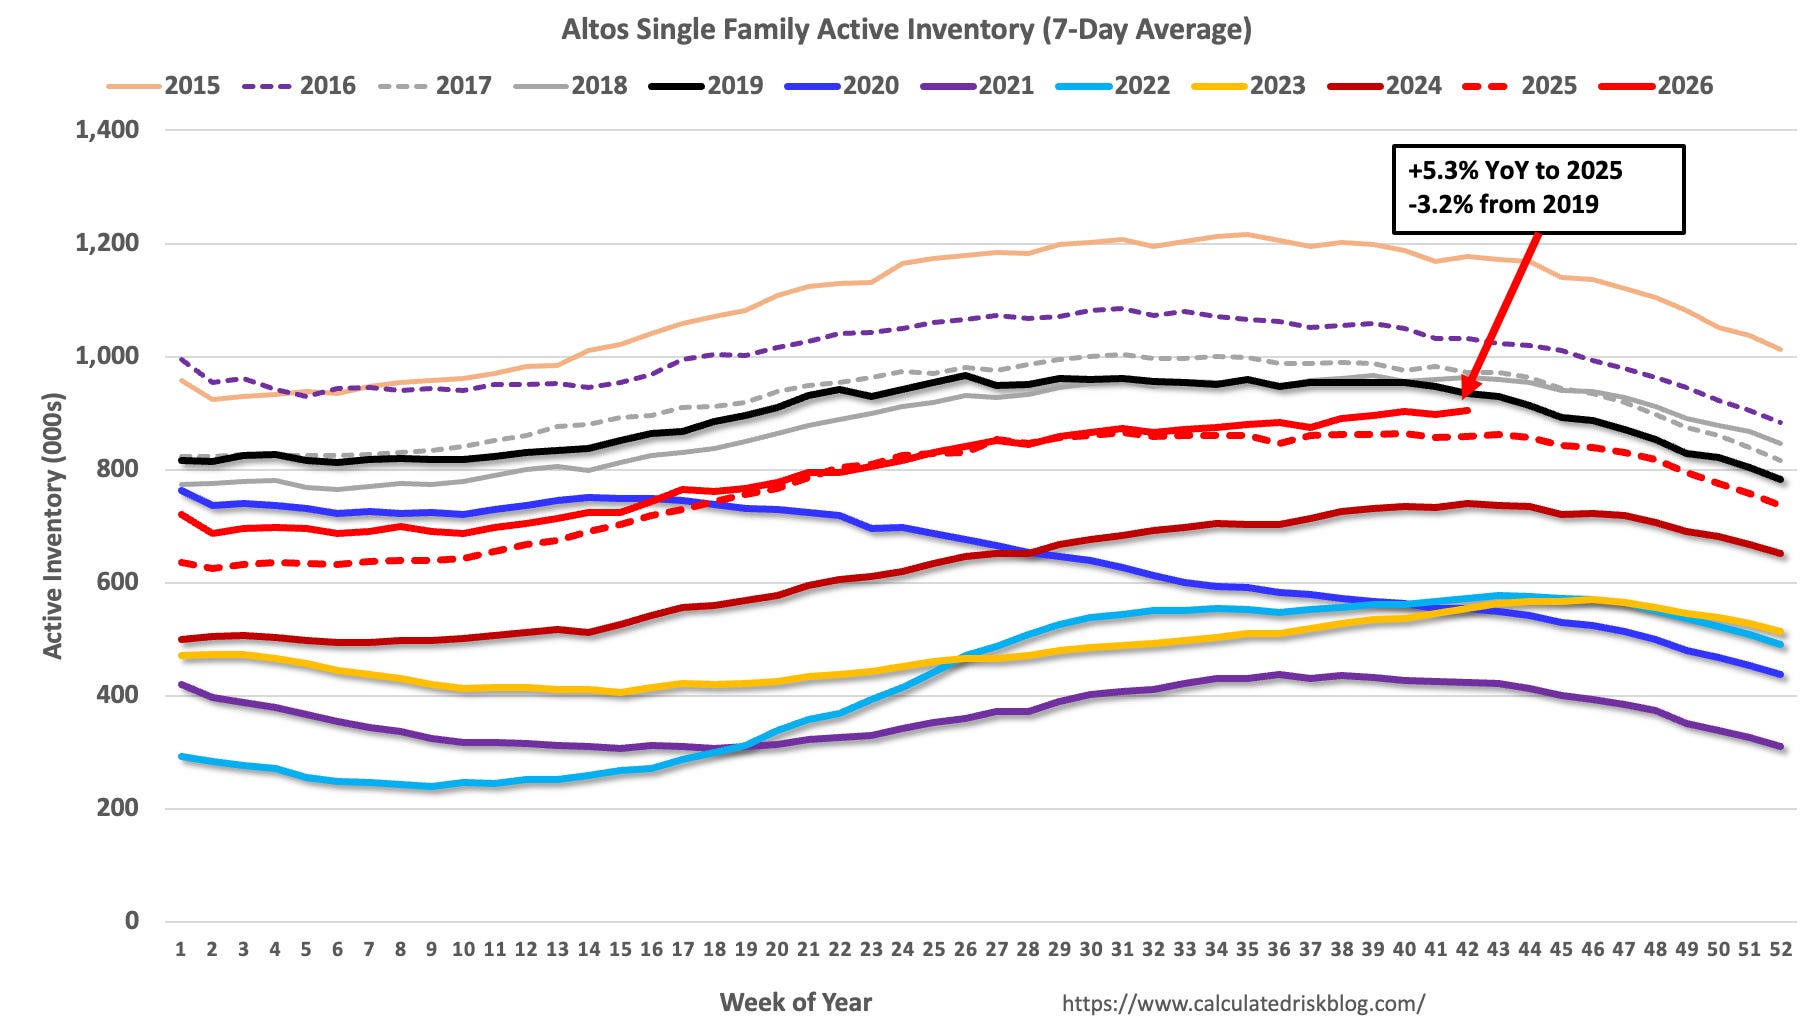
The red line is for 2026. The black line is for 2019.
Inventory was up 5.3% compared to the same week in 2025 (the previous week it was up 4.8%), and down 3.2% compared to the same week in 2019 (last week it was down 5.1%).
Inventory has picked up slightly and demand is weak. With 30-year mortgage rates close to 7 1/2%, existing home sales will likely slow over the coming months and house prices will be under pressure.
Homebuilder Confidence Below Pandemic Low
From the NAHB: Builder Sentiment Falls on Rising Rates
Rising mortgage rates, energy and material costs, and worsening labor and lot conditions have pushed builder sentiment to a 14-year low.
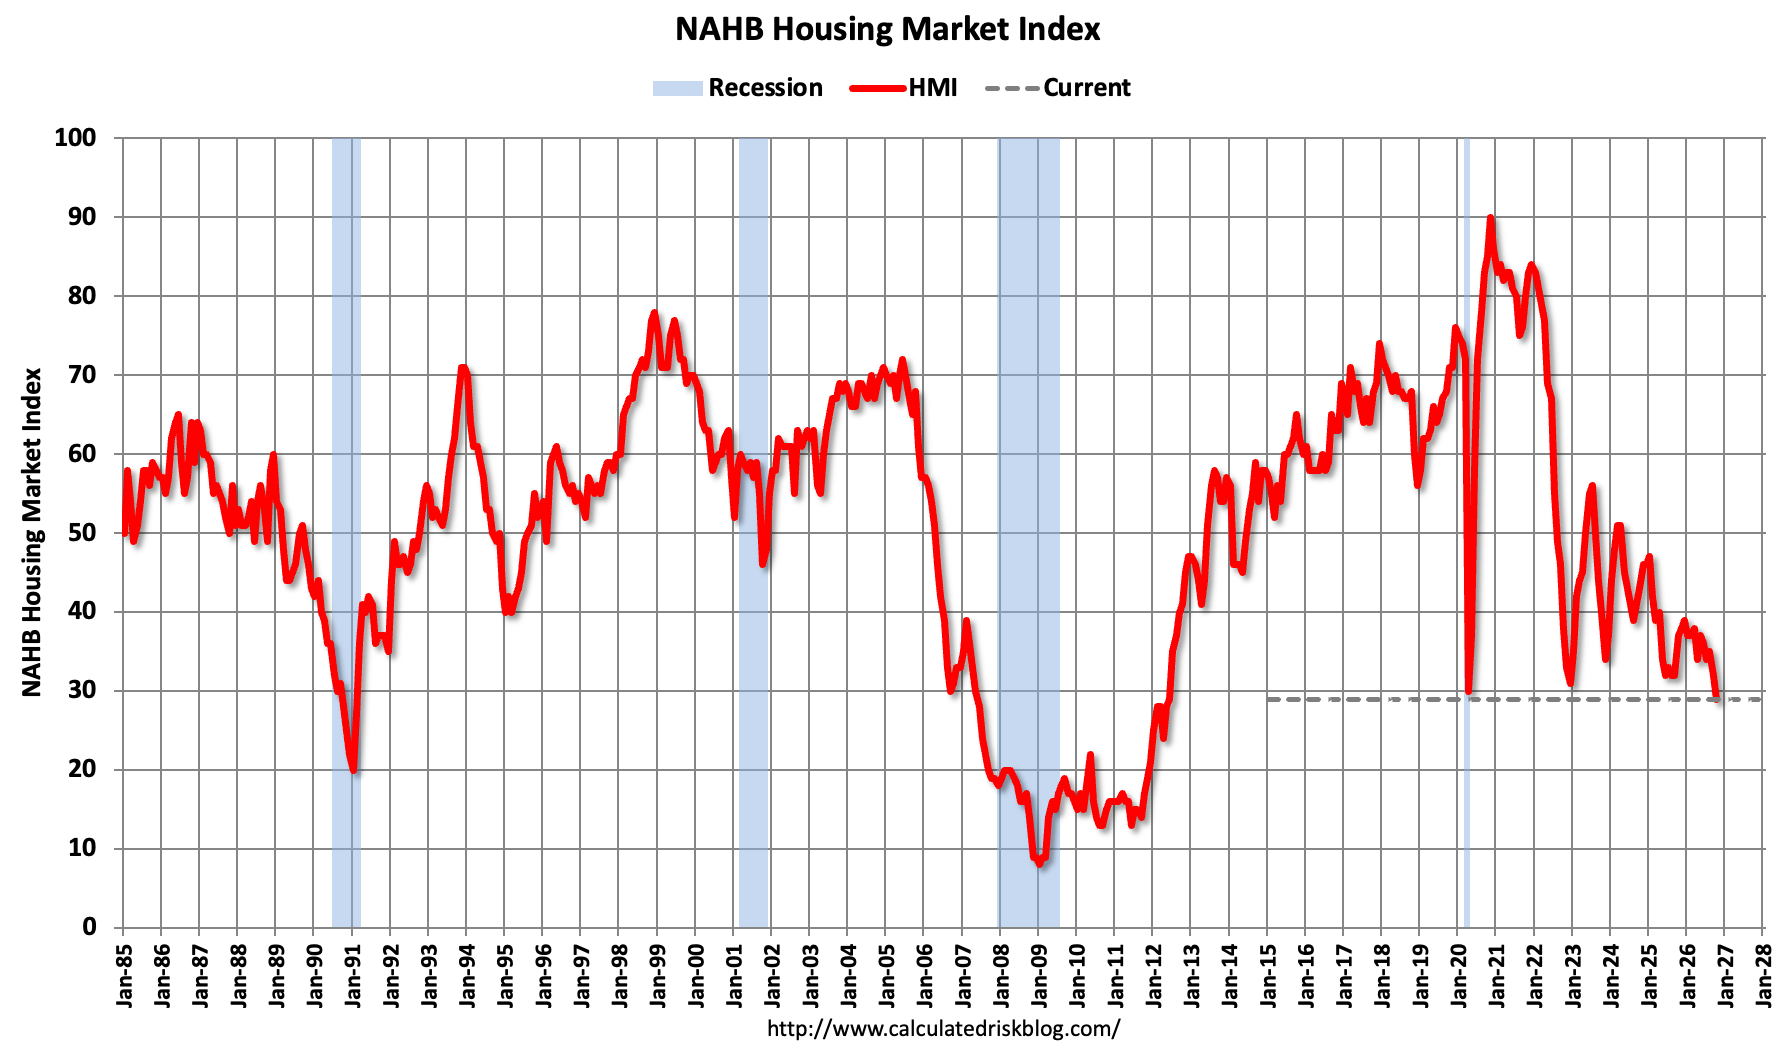
Builder confidence in the market for newly built single-family homes fell three points to 29 in October, according to the National Association of Home Builders (NAHB)/Wells Fargo Housing Market Index (HMI) released today. The reading was the lowest since June 2012. …
“Housing remains squeezed by supply-side constraints and significant affordability challenges,” said NAHB Chief Economist Robert Dietz. “Demand persists, but higher mortgage rates, elevated construction costs and weaker consumer confidence are keeping more buyers on the sidelines. As a result, buyer traffic has fallen to its lowest level since April 2012, excluding the pandemic’s onset in April 2020.” …
The latest HMI survey found that 43% of builders cut prices in October, the highest share during the 2020-2026 period. The average price cut remained at 6% for the seventh consecutive month. Meanwhile, 65% of builders reported using sales incentives in October, the 19th straight month at least 60% of builders have done so.
Pending Home Sales
The NAR reports: Pending Home Sales Decreased 7.3% in September
Month-Over-Month
7.3% decrease in pending home sales
Declines in all four regions
Year-Over-Year
11.3% decrease in pending home sales
Declines in all four regions
Pending home sales in September decreased by 7.3% month-over-month and 11.3% year-over-year, according to the National Association of REALTORS® Pending Home Sales report. The report helps the real estate ecosystem—including agents, homebuyers and sellers—better understand the housing market by providing data on the level of home sales under contract.
Month-over-month pending home sales declined in all four major U.S. regions. The West had the largest decrease, followed by the South, Midwest and Northeast. Year-over-year pending home sales also declined in all four regions.
“Market conditions weakened in September due to fast-rising mortgage rates,” said NAR Chief Economist Dr. Lawrence Yun. “Although job growth and income gains can support home purchases, housing affordability is more affected by changes in mortgage rates.”