The Housing Market is Still Hot, but We are Seeing Signs of a Shift
House prices are up 20% year-over-year. Inventory is near record lows. And real estate agents are still selling homes well above list price. And on credit, lending standards have been reasonably solid, and mortgage delinquencies are very low.
However, mortgage rates are up sharply (from 3% six months ago to 5.64% today), and we are starting to see an increase in inventory levels. House prices are too high based on fundamentals like price-to-income and price-to-rent. And some investors appear to be pulling back due to higher cap rates, and some builders are reporting buyers actually want to negotiate on price!
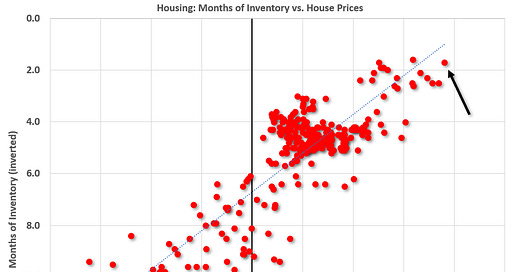
The graph below shows existing home months-of-supply (inverted, from the NAR) vs. the seasonally adjusted month-to-month price change in the Case-Shiller National Index (both since January 1999 through February 2022). Note that the months-of-supply is not seasonally adjusted.
This is important, because it shows the relationship, and it also shows the current low level of inventory (months-of-supply).
In February, the months-of-supply was at 1.7 months, and the Case-Shiller National Index (SA) increased 1.90% month-over-month. The black arrow points to the February 2022 dot. In the March existing home sales report, the NAR reported months-of-supply increased to 2.0 months.
However, to get back to more normal price changes, the months-of-supply will have to increase to the 4-to-6-month range. That could happen with a combination of an increase in inventory and a decrease in the sales rate. To see national price declines, months-of-supply would probably have to increase to over 6 months.
On mortgage rates, it is the change in monthly payments that impacts housing. Monthly payments include principal, interest, taxes, insurance (PITI), and sometimes HOA fees (Homeowners Association). We could also include maintenance, utilities and other costs. The following graph shows the year-over-year change in principal & interest (P&I) assuming a fixed loan amount since 1977. Currently P&I is up about 35% year-over-year for a fixed amount (this doesn’t take into account the change in house prices).
The last time we saw an increase like this in monthly payments was in the ‘78 to’82 period. This is one reason I’ve been suggesting Housing: Don't Compare the Current Housing Boom to the Bubble and Bust, Look instead at the 1978 to 1982 period for lessons.
And on cap rates slowing investors, and buyers negotiating on prices, from Rick Palacios, Director of Research at John Burns Real Estate Consulting:
And here are some comments from David Singelyn, CEO of American Homes 4 Rent (via Rick Palacios): “when we talk about acquisitions, what we are talking is our cost of capital and matching that to what the opportunity set is”, and “we’re tightening up a bit of our buy boxes”.
Remember: Housing is a key transmission mechanism for the FOMC
It is important to understand that housing is a key transmission mechanism for Federal Open Market Committee (FOMC) policy. When the FOMC raises rates, housing is a key target. For example, higher rates change the trade-off between buying and renting, and also changes the calculation for investors. Higher rates have already slowed down the “home ATM” (Mortgage Equity Withdrawal) and will impact demand.
A key question is how much inflation is transitory (due to the pandemic and the invasion of Ukraine, and the related impact on supply chains), and how much inflation is embedded. The FOMC cannot end the pandemic or stop the war. But they can slow embedded inflation.
If inflation is mostly transitory, the impact on housing will be less than if inflation is embedded. However, if inflation is mostly embedded, the FOMC will continue to raise rates until housing slows down, bringing down inflation.
Vehicle sales are another important transmission mechanism (as is corporate investment). However, vehicle sales have been impacted by supply disruptions, and probably won’t decline much due to higher interest rates.
Where are we? The housing market is still hot, but there are clear signs of slowing.
Where it's going
The housing slowdown will impact housing starts, new and existing home sales and house prices. Housing analysts have been downgrading their forecasts for 2022, and I expect further downgrades soon.
For example, Fannie Mae has lowered their forecast for new home sales to 788 thousand in 2022 from 897 thousand (end of 2021 forecast). That is about a 12% decline. However, they’ve increased their house price forecast from 7.4% to 10.8% for 2022 (prices are already up about 5% in Q1).
The NAHB has lowered their forecast for new home sales to 776 thousand, down from 840 thousand. They now see existing home sales at about 5.3 million in 2022.
And Lawrence Yun, NAR's chief economist is predicting existing home sales will be down 9% in 2022, from 6.12 million in 2021 to around 5.6 million in 2022.
The size of the declines in new and existing home sales, and housing starts, will depend on how much inflation is embedded, and therefore how much the Fed will have to raise rates (and reduce their balance sheet) to control inflation. I don’t expect 50% declines (like in the ‘78 to ‘82 period), but a 20% decline in the annualized sales and starts rates seems possible later this year depending on inflation and mortgage rates.
For house prices, it is possible we will see price declines in some areas, but with solid lending I don’t expect national nominal price declines. And we definitely will not see cascading price declines like during the housing bust, since there will be few distressed sales (most homeowners have significant equity).
The key to adjusting forecasts is to watch inventory. Altos Research reported this morning that existing home inventory was down just 1.6% year-over-year last week. It now appears inventory will be up year-over-year this week, but still down over 50% from two years ago. I have more on inventory soon.