


Housing Starts Decreased to 1.366 million Annual Rate in January

From the Census Bureau: Permits, Starts and Completions
Housing Starts:
Privately-owned housing starts in January were at a seasonally adjusted annual rate of 1,366,000. This is 9.8 percent below the revised December estimate of 1,515,000 and is 0.7 percent below the January 2024 rate of 1,376,000. Single-family housing starts in January were at a rate of 993,000; this is 8.4 percent below the revised December figure of 1,084,000. The January rate for units in buildings with five units or more was 355,000.
Building Permits:
Privately-owned housing units authorized by building permits in January were at a seasonally adjusted annual rate of 1,483,000. This is 0.1 percent above the revised December rate of 1,482,000, but is 1.7 percent below the January 2024 rate of 1,508,000. Single-family authorizations in January were at a rate of 996,000; this is virtually unchanged from the revised December figure of 996,000. Authorizations of units in buildings with five units or more were at a rate of 427,000 in January.
emphasis added
The first graph shows single and multi-family housing starts since 2000 (including housing bubble).
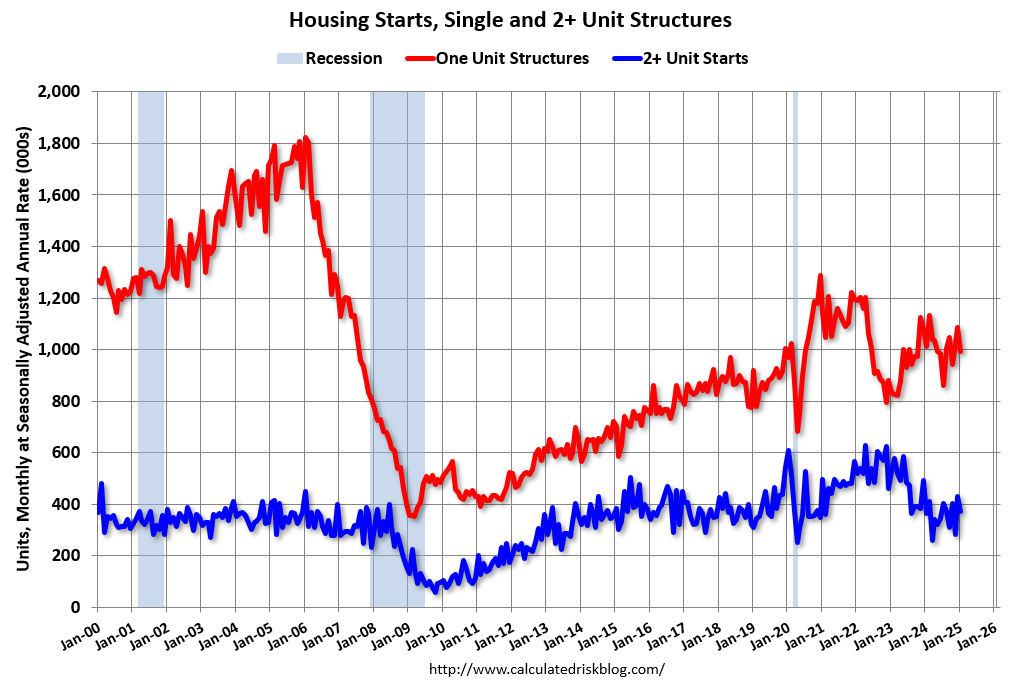
Multi-family starts (blue, 2+ units) decreased month-over-month in January. Multi-family starts were up 2.2% year-over-year. Single-family starts (red) decreased in January and were down 1.8% year-over-year.
Note that the weakness in 2022 and early 2023 had been in single family starts (red), then the weakness moved to multi-family. Multi-family starts might have bottomed early in 2024.
The second graph shows single and multi-family starts since 1968. This shows the huge collapse following the housing bubble, and then the eventual recovery - and the pandemic related volatility.

Total housing starts in January were below expectations; however, starts in November and December were revised up.
The third graph shows the month-to-month comparison for total starts between 2024 (blue) and 2025 (red).
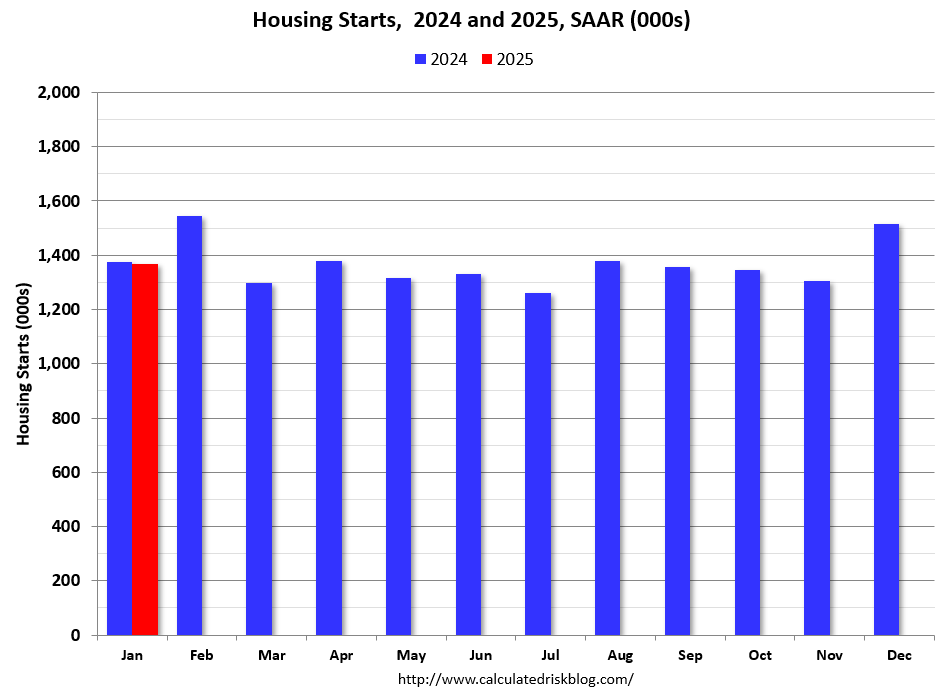
Total starts were down 0.7% in January compared to January 2024. There were significant regional differences in January with starts in the Northeast region down sharply year-over-year (likely weather related).
Single family starts have been up year-over-year in 14 of the last 19 months, whereas multi-family has been up year-over-year in only 4 of last 20 months.
Multi-Family Housing Units Under Construction Continue to Decline
The following content is for paid subscribers only. Thanks to all paid subscribers!
Keep reading with a 7-day free trial
Subscribe to CalculatedRisk Newsletter to keep reading this post and get 7 days of free access to the full post archives.