


Housing Starts Increased to 1.356 million Annual Rate in August

From the Census Bureau: Permits, Starts and Completions
Housing Starts:
Privately-owned housing starts in August were at a seasonally adjusted annual rate of 1,356,000. This is 9.6 percent above the revised July estimate of 1,237,000 and is 3.9 percent above the August 2023 rate of 1,305,000. Single-family housing starts in August were at a rate of 992,000; this is 15.8 percent above the revised July figure of 857,000. The August rate for units in buildings with five units or more was 333,000.
Building Permits:
Privately-owned housing units authorized by building permits in August were at a seasonally adjusted annual rate of 1,475,000. This is 4.9 percent above the revised July rate of 1,406,000, but is 6.5 percent below the August 2023 rate of 1,578,000. Single-family authorizations in August were at a rate of 967,000; this is 2.8 percent above the revised July figure of 941,000. Authorizations of units in buildings with five units or more were at a rate of 451,000 in August.
emphasis added
The first graph shows single and multi-family housing starts since 2000 (including housing bubble).
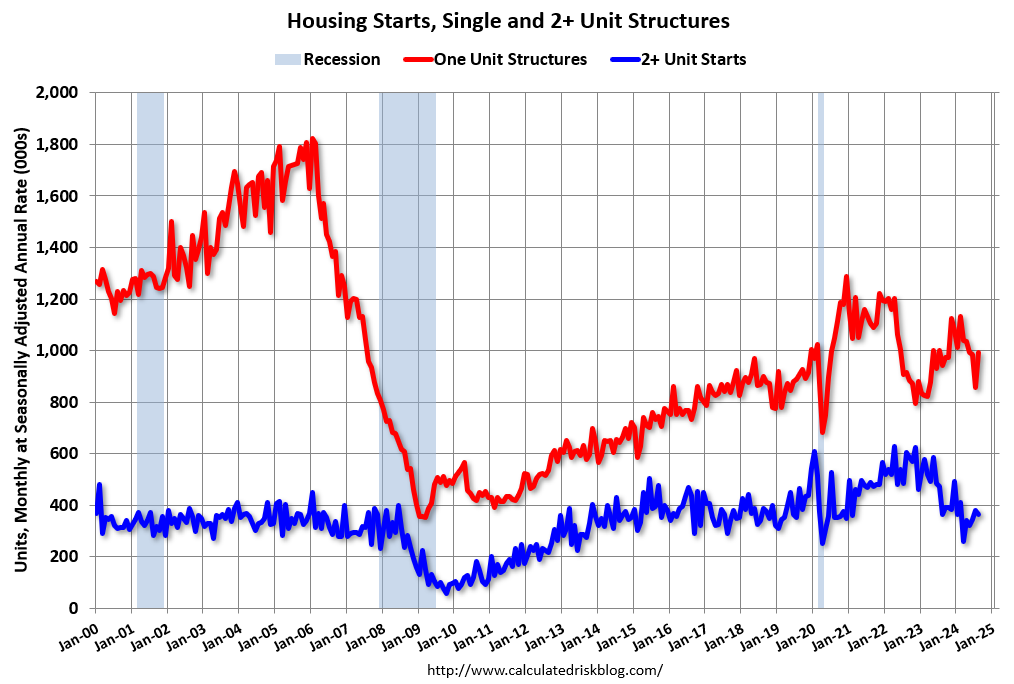
Multi-family starts (blue, 2+ units) increased in August compared to July. Multi-family starts were up 5.5% year-over-year. Single-family starts (red) increased in August and were up 5,1% year-over-year.
Note that the weakness in 2022 and early 2023 had been in single family starts (red), then the weakness moved to multi-family. Single family bounced back in August from July, and multi-family starts might have bottomed earlier this year.
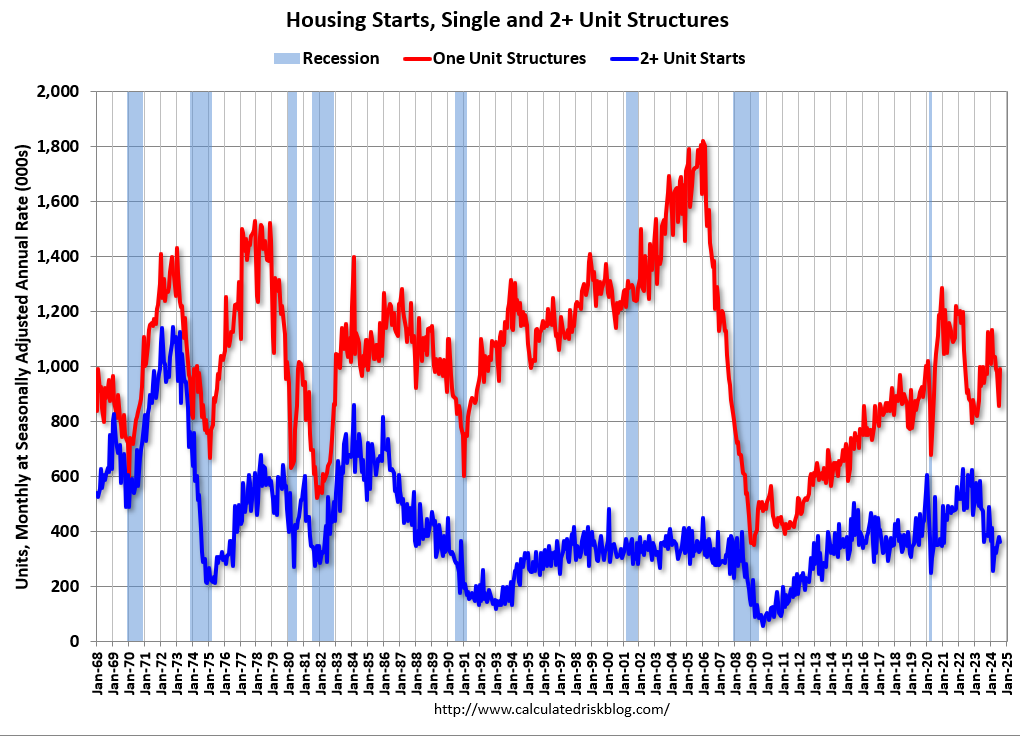
The second graph shows single and multi-family starts since 1968. This shows the huge collapse following the housing bubble, and then the eventual recovery - and the recent weakness.
Total housing starts in August were above expectations and starts in June and July were revised slightly. A solid report.
The third graph shows the month-to-month comparison for total starts between 2023 (blue) and 2024 (red).
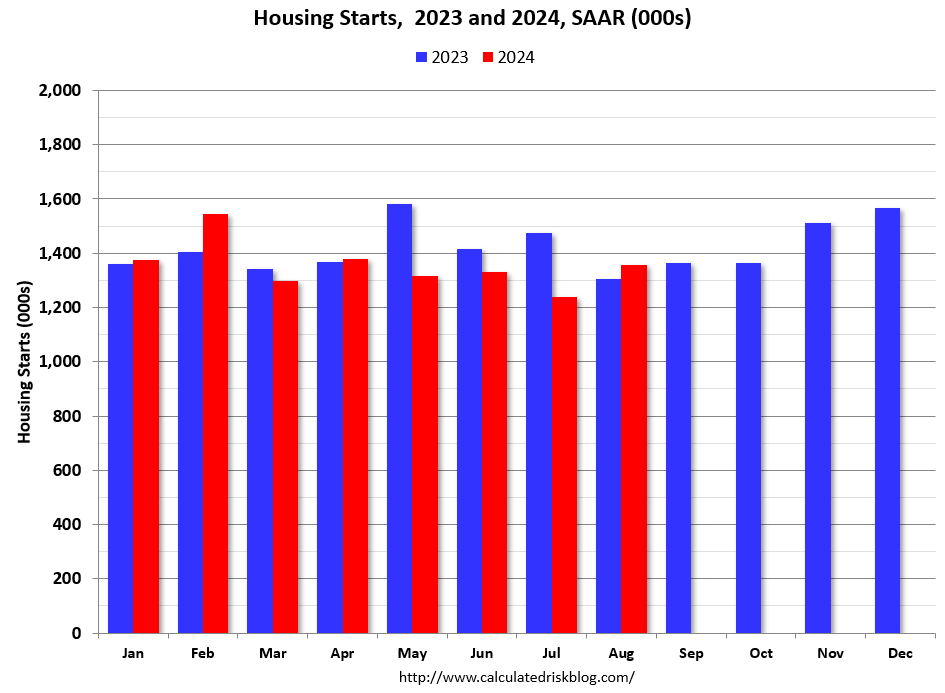
Total starts were up 3.9% in August compared to August 2023.
The YoY increase in August total starts was due to an increase in both multi-family and single-family starts.
Single family starts have been up year-over-year in 12 of the last 14 months, whereas multi-family has been up year-over-year in only 2 of last 14 months. Year-to-date (YTD), total starts are down 4.0% compared to the same period in 2023. Single family starts are up 10.4% YTD, and multi-family down 32.6% YTD.
Multi-Family Housing Units Under Construction Continue to Decline
The following content is for paid subscribers only. Thanks to all paid subscribers!
Keep reading with a 7-day free trial
Subscribe to CalculatedRisk Newsletter to keep reading this post and get 7 days of free access to the full post archives.