

Housing Starts increased to 1.615 Million Annual Rate in August
Housing Starts increased to 1.615 Million Annual Rate in August
Most Multi-Family Units Under Construction Since 1974

From the Census Bureau: Permits, Starts and Completions
Housing Starts:
Privately‐owned housing starts in August were at a seasonally adjusted annual rate of 1,615,000. This is 3.9 percent above the revised July estimate of 1,554,000 and is 17.4 percent above the August 2020 rate of 1,376,000. Single‐family housing starts in August were at a rate of 1,076,000; this is 2.8 percent below the revised July figure of 1,107,000. The August rate for units in buildings with five units or more was 530,000
Building Permits:
Privately‐owned housing units authorized by building permits in August were at a seasonally adjusted annual rate of 1,728,000. This is 6.0 percent above the revised July rate of 1,630,000 and is 13.5 percent above the August 2020 rate of 1,522,000. Single‐family authorizations in August were at a rate of 1,054,000; this is 0.6 percent above the revised July figure of 1,048,000. Authorizations of units in buildings with five units or more were at a rate of 632,000 in August.
emphasis added
The first graph shows single and multi-family housing starts since 2000 (including housing bubble).

Multi-family starts (red, 2+ units) increased in August compared to July, and the volatile multi-family starts were up 53% year-over-year in August.
Single-family starts (blue) decreased in August, and were up 5% year-over-year (starts slumped at the beginning of the pandemic, but picked up later in 2020).
The second graph shows single and multi-family starts since 1968.
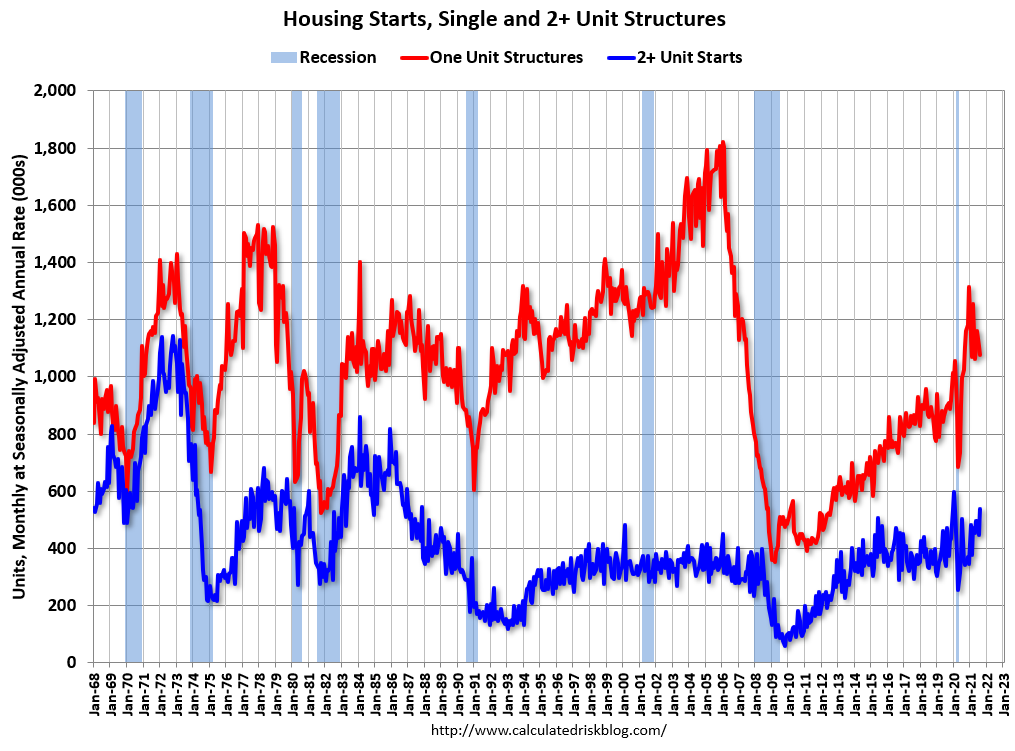
The second graph shows the huge collapse following the housing bubble, and then the eventual recovery (but still not historically high).
Total housing starts in August were well above expectations, and starts in June and July were revised up slightly.
Please share with friends and colleagues.The third graph shows the month to month comparison for total starts between 2020 (blue) and 2021 (red).
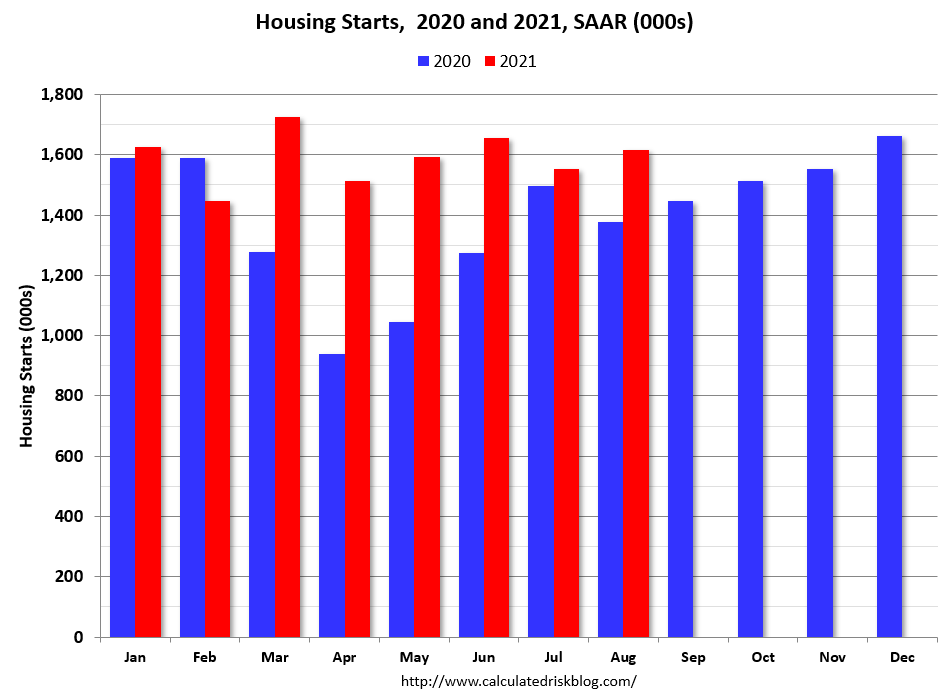
Starts were up 17.4% in August compared to August 2020. The year-over-year comparison are more difficult towards the end of 2021. In 2020, starts were off to a strong start before the pandemic, and with low interest rates, and little competing existing home inventory, starts finished 2020 strong.
The fourth graph shows starts under construction, Seasonally Adjusted (SA).
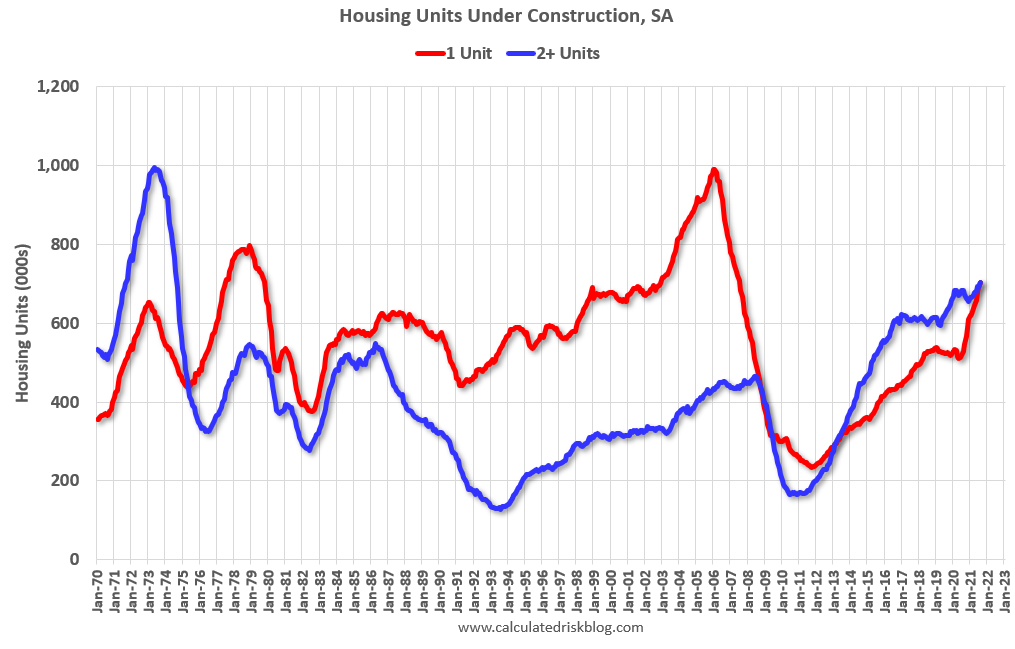
Red is single family units. Currently there are 702 thousand single family units under construction (NSA). This is the highest level since 2007.
For single family, most of these homes are already sold (Census counts sales when contract is signed). The reason there are so many homes is probably due to construction delays. Since most of these are already sold, it is unlikely this is “overbuilding”, or that this will impact prices.
Blue is for 2+ units. Currently there are also 702 thousand multi-family units under construction. This is the highest level since 1974! For multi-family, construction delays are probably also a factor. The completion of these units should help with rent pressure.
Census will release data next year on the length of time from start to completion, and that will probably show long delays in 2021. In 2020, it took an average of 6.8 months from start to completion for single family homes, and 15.4 months for buildings with 2 or more units.
Combined, there are 1.404 million units under construction. This is the most since May 2006.
Please Subscribe (all content is currently Free without Ads)