

ICE Mortgage Monitor: House Price Growth Slows, Inventory Surges in Florida and Texas
ICE Mortgage Monitor: House Price Growth Slows, Inventory Surges in Florida and Texas

Press Release: ICE Mortgage Monitor: Rate drops make August most affordable month since February, as home price growth cools to 12-month low
Declining mortgage rates have brought home affordability to its best level since February and boosted refinance incentive for many recent-vintage mortgages
With 30-year conforming rates down 60 bps from just over 7% in May, the principal and interest payment on the average-priced home purchase is $145 less per month than just three months ago
The share of income needed to make payments on that home (34.3%) is still 10 pp above its 30-year average and ICE Market Trends data shows recent record highs in down payments and credit scores
Spurred by rate declines, purchase loan demand had two of its best weeks since March, but remains noticeably below the levels seen earlier this year and in 2023 when rates were at comparable levels
The ICE Home Price Index for July showed the annual rate of home price growth slipping to +3.6% from +4.1% in June, marking the slowest pace in 12 months on rising inventory and still-soft demand
While prices were up +0.19% from June at the national level, they fell by -0.25% or more across each of Florida’s nine largest metros which, along with Austin, saw the largest single-month declines in July
In the Midwest and Northeast, inventory shortages persist, and prices continued to push higher in July
emphasis added
Mortgage Delinquencies Declined in July
Here is a graph on delinquencies from ICE. Overall delinquencies decreased in July and are below the pre-pandemic levels. Source: ICE McDash
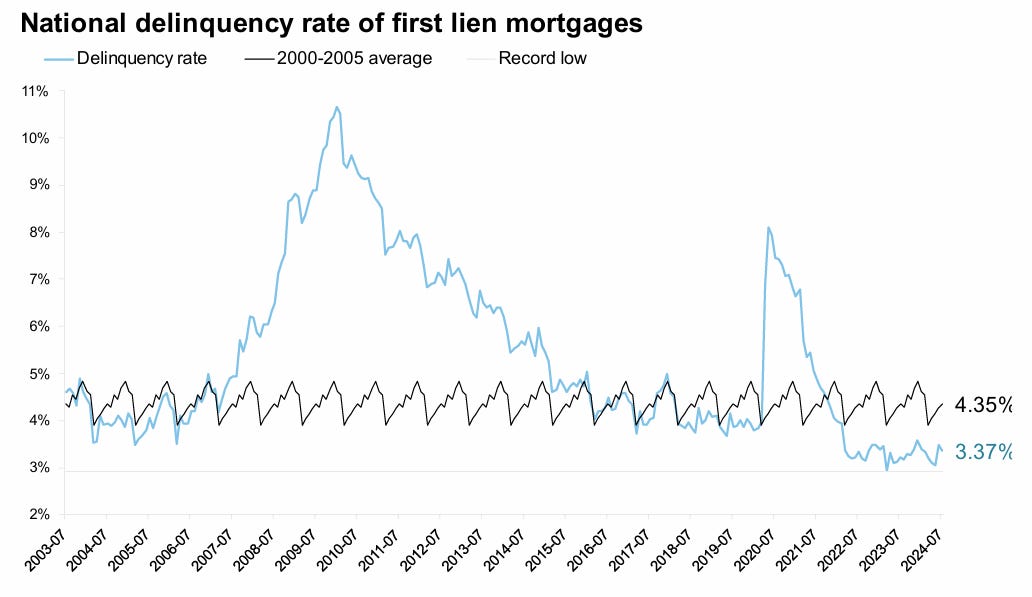
• The national delinquency rate fell 12 basis points (bps) to 3.37% in July, offsetting some of June’s calendar-related rise – dropping 3.5% for the month but up 4.8% from the same time last year
• Delinquencies declined in all major markets except Houston, where Hurricane Beryl resulted in an estimated 8.5K mortgage holders falling behind on payments
• Serious delinquencies (loans 90+ days past due but not in active foreclosure) rose 5K (+1.1%) to a five-month high, but are still down -33K (-7.0%) from the same time last year
• The number of borrowers a single payment past due dropped by -77K in July, while 60-day delinquencies climbed 11K
Inventory Surges in Florida and Texas
The local data I track is indicating that Florida and Texas inventory is above normal, whereas inventory is still low in most of the country.
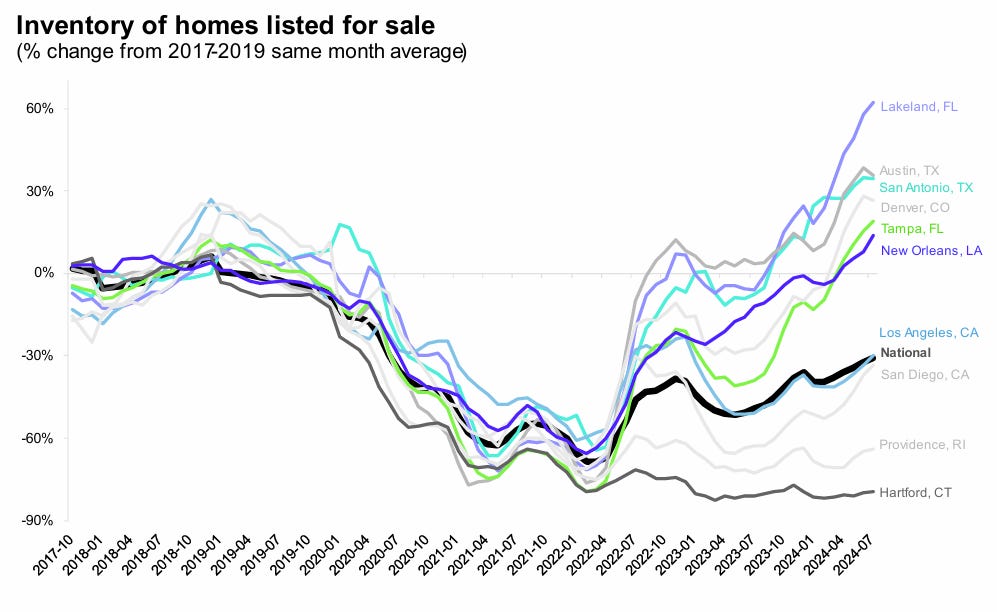
Source: ICE / Realtor.com
• For-sale inventory continued to improve across most of the U.S. in July On a non-adjusted basis, the number of homes listed for sale rose by 5% in the month, up 37% year over year, while the adjusted deficit fell to 32%, the shallowest it has been since mid-2020
• New listing volumes remain weak, however, and have been worsening in recent months 26% fewer homes were listed in July than would normally be expected based on 2017-2019 same month averages – that’s the deepest deficit in 12 months, after a slow improvement late last year
• Without a meaningful return in new listing volumes, the market is reliant on weak demand to grow inventory, limiting the ability to see stronger demand and sales volumes without a corresponding risk of inventory drawdowns
• Every major market has more inventory for sale that at the same time last year, with the largest improvements in the state of Florida, along with individual markets, including Denver, Seattle, and parts of Texas
• More than 1 in 5 markets are now back to, or above, 2017-2019 inventory levels, with markets like Lakeland, Austin, San Antonio, Denver, and Palm Bay all having at least 25% more homes for sale than typical for this time of year
“Annual price growth slowed to +3.6%”
Here is the year-over-year in house prices according to the ICE Home Price Index (HPI). The ICE HPI is a repeat sales index. ICE reports the median price change of the repeat sales. The index was up 3.6% year-over-year in July, down from 4.1% YoY in June.
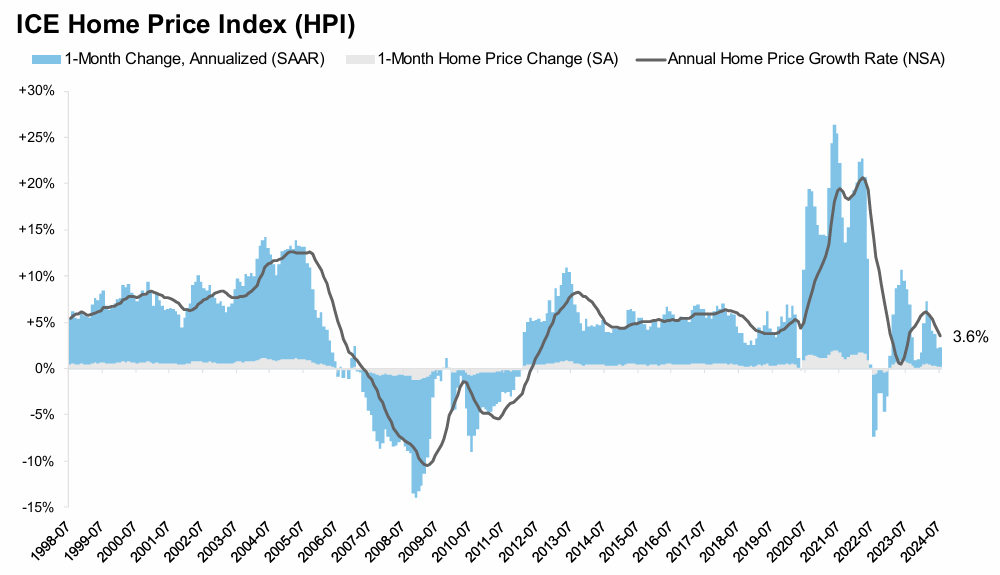
Source: ICE Home Price Index (HPI)
• Rising inventory and soft demand led to further home price cooling in July, with the annual rate of home price growth slipping to +3.6% from +4.1% the month prior
• On a seasonally adjusted basis, prices rose by +0.19%, equivalent to a seasonally adjusted annualized rate (SAAR) of +2.3%, suggesting possible further slowing in annual home price growth rate over the next couple of months
• If the current pace of seasonally adjusted gains were to continue, it would result in annual home price growth cooling to 3.0-3.5% over the next couple of months before catching a modest tailwind in Q4 due to softer comps from late 2023
There is much more in the mortgage monitor.