


Discover more from CalculatedRisk Newsletter
Lawler: Early Read on Existing Home Sales in January
More Fun with Expected “Real” Rates

From housing economist Tom Lawler:
Based on publicly-available local realtor/MLS reports released across the country through today, I project that existing home sales as estimated by the National Association of Realtors ran at a seasonally adjusted annual rate of 4.09 million in January, down 3.5% from December’s preliminary pace and up 2.3% from last January’s seasonally adjusted pace.
Note that this month’s existing home sales release will incorporate new seasonal factors, which will probably “smooth” monthly sales a little for last year – with slightly slower SA sales for the February-May period and slightly higher SA sales for the June-October period. I am assuming this January’s seasonal factor won’t be materially different from last January’s.
Local realtor/MLS reports suggest that the median existing single-family home sales price last month was up by about 5% from a year earlier.
CR Note: The NAR is scheduled to release January Existing Home sales on Friday, February 21st at 10:00 AM. The consensus is for 4.10 million SAAR, down from 4.24 million in December. Last year, the NAR reported sales in January 2024 at 4.00 million SAAR.
More Fun with Expected “Real” Rates
Just for fun, I constructed some data on (1) expected short-term rates five years out; and (2) expected inflation five year out. For the former I used such expectations from Federal Reserve economists Kim and Wright (available at Three-Factor Nominal Term Structure Model) and for the latter I used the implied expected one-year inflation rate five year out from the Federal Reserve Bank of Cleveland’s “Inflation Expectations” report. Note that these “inflation” expectations are for the Consumer Price Index.
The following chart shows the difference between the expected one-year short-term rate five years in the future and the expected one-year inflation rate five years in the future. Also shown is a 12-month centered moving average. The reason I focus on expectations five years into the future is that such a measure will presumably show less cyclical volatility than short-term expectation measures, especially during recessions not expected to last long.
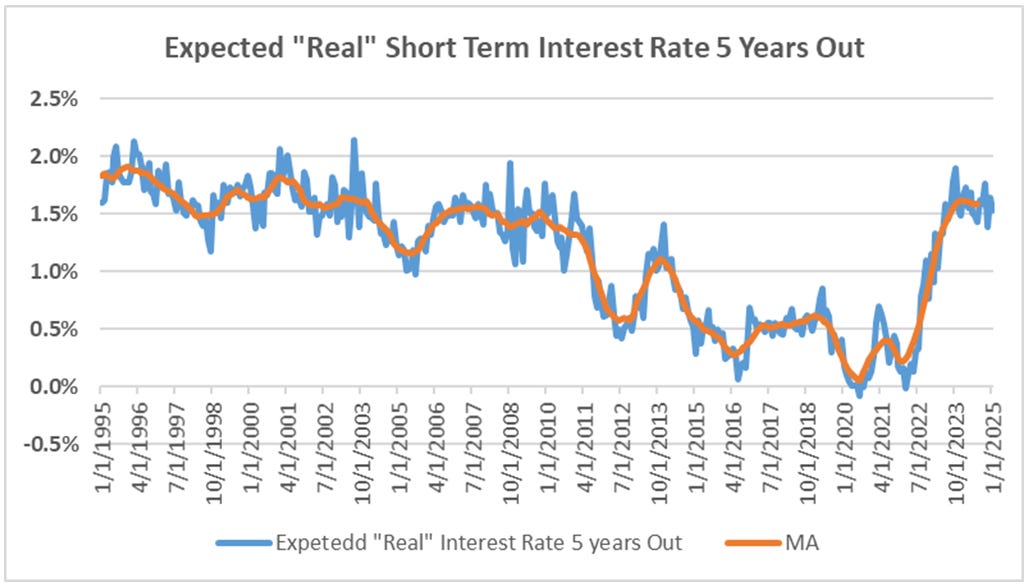
Note that this expected “real” interest rate trended only slightly downward from 1995 through the 2008 and didn’t fluctuate that much, but it dropped off sharply a bit after the onset of the “Great Recession/Financial Crisis,” and when the Fed got serious about “quantitative easing.” This rate remained low for years as central banks and private market investors around the globe remained concerned about the fragility of financial markets. And then, of course, the pandemic hit, which brought with it massive uncertainty as well as unprecedented central bank intervention in the financial markets. (The “blip” up in this measure in 2013 coincided with the infamous “taper tantrum” of that year.)
With Covid fears gone and with the end of massive central bank intervention in financial markets, this expected “real” interest rate has now returned to more “normal” levels. For example, this measure in January 2025 was 1.53, almost identical to the 1.51% average from January 2001 to December 2009.
There are a few caveats to this chart. First, it assumes that the term premium estimates from Kim and Wright are accurate, and it should be noted that other term premium models produce different results. Second, it assumes that the Federal Reserve Bank of Cleveland’s Inflation Expectations model is accurate, which may or not be the case. And finally, the inflation expectations measure is based on the CPI. If in fact “the market” believes that the PCE price index is a better measure of inflation, then a PCE-based measure of expected inflation in the future would be more appropriate. Unfortunately, there is no such market-based measure.
On this latter score, it is worth noting that over the last 10 years the annualized growth in the CPI exceeded that of the PCE price index by 0.47 percentage points, and over the last 20 years the annualized growth of the CPI exceeded that of the PCE price index by 0.36 percentage points. As such, if one wanted a “PCE-based” measure of the expected future “real” interest rate one should probably “haircut” the CPI-based measure by about 0.4 percentage points.
Thus, e.g., if the CPI based expected future short-term real interest rate 5 years out is 1.53% (the January 2025 number), then a PCE based expected future short-term real interest rate 5 years out would be around 1.93%.
With all of these caveats in mind, financial markets appear to believe that the current neutral “real” interest rate is back to where it was prior to the Financial Crisis.


