Lawler: Mortgage/Treasury Spreads, Part I
CR Note: In earlier posts, I used a quick and dirty historical comparison between the 10-year treasury yield and the 30-year fixed mortgage rate when discussing mortgage rates. For example, see How High will Mortgage Rates Rise? Of course, it is more complicated, as housing economist Tom Lawler explains.
From Tom Lawler:
Many relatively unsophisticated analysts look at the spread between the 30-year mortgage rate from Freddie Mac’s primary mortgage market survey (PMMS) and the 10-year Treasury yield as an indicator of whether mortgage rates are “high” or “low” relative to overall interest rate levels. While there are a host of reasons why the mortgage to 10-year spread is a poor guide to relative “value” (something I will get into in later reports), there are also issues with the Freddie Mac historical mortgage rate series (at least the one used by many analysts) that can seriously distort historical trends.
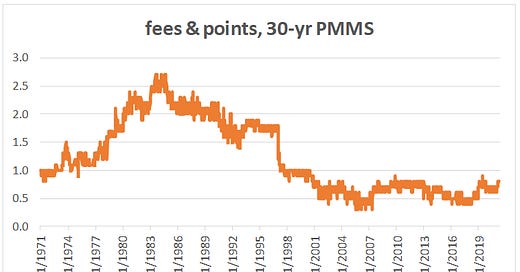
The most widely quoted statistic from the PMMS is the 30-year mortgage rate from the survey. Yet the survey also shows the typical/average fees/points associated with this interest rate, and these fees/points have changed dramatically over time. Below is a historical chart showing the fees/points charged along with the PMMS rate.
As the chart shows, from the late 70’s to the late 90’s the average fees/points associated with the PMMS mortgage rate were substantially higher than has been the case over the last two decades. As such, the spread between the “effective” mortgage rate and the PMMS mortgage rate was considerably wider from the late 70’s to the late 90’s than has been than in the more recent decades.
Note: “adjusted” (or effective) PMMS rate uses a Q&D conversion of fees/points to yield.
Another issue with comparing the PMMS mortgage rate with the 10-year Treasury rate, especially over short periods of time, is timing. The PMMS is released on Thursday based on a survey conducted from Monday through Wednesday. According to Freddie Mac, “Survey reminder emails are sent out on Mondays and lenders are asked to respond by close of business Wednesday. If we have received no response on Tuesday, we follow-up with a reminder email on Wednesday morning. We receive a few responses on Monday, but most responses are returned on Tuesday with the balance received on Wednesday. So, in general, the PMMS rates reflect loans offered Monday through Wednesday.”
If interest rates move considerably during the week (which has more often than not been the case recently) then the PMMS survey results when released may not reflect market conditions at the time of the release. For example, in the report released April 28 Freddie reported a decline of one basis point in the PMMS rate (with no change in fees/points), which was consistent with MBS prices on Tuesday of last week relative to Tuesday of the previous week, but not consistent with the significantly lower MBS prices and higher yields of Thursday and Friday of last week.
Another source of “primary” mortgage rates is available from mortgage news daily. A big plus is that it is available daily (as of noon each day) and is based on lender rate sheets (the rate is for high quality borrowers with a 20% down payment). The negatives are that (1) the history only goes back to April 29, 2009); (2) points charged have varied over time (though the points charged has been flat at 0.4 point since 2015); and (3) there are a few days when credit markets were open but there was no rate available, and least in the data then sent me.
Here is the MND 30-year mortgage rate from 12/1/2017 through 5/1/2022.
And here is the MND 30-year FRM vs. 10-year Treasury rate.
As noted earlier, a comparison of the 30 year FRM to the 10 year Treasury is not a great measure of relative value, for several reasons, and here a few. (1) This measure only looks at one spot of the Treasury yield curve, and does not take into account the whole yield curve. Generally (and ceteris paribus), the FRM-10 year spread is narrower when the yield curve is steeper and wider when the yield curve is flatter/inverted. (2) This measure does not take into account interest rate volatility. 30-year fixed rate mortgages have embedded in them a very valuable prepayment option that is actually difficult to value. The owner of the mortgage has effectively written a prepayment (put) option while the borrower has “purchased” a put option, and when interest rate volatility rises the value of the put option owned by the borrower rises while the value of the put written by the mortgage owner declines. As a result, an increase in interest rate volatility will, ceteris paribus, cause mortgage rates to increase relative to yields on other non-callable securities such as Treasuries.
With that in mind, obviously interest rate volatility has increased dramatically over the course of this year, both actual volatility and implied volatility on options on fixed-income securities. While I don’t have access to a time series on implied volatility on various interest rate swaptions, I do have a limited time series on implied volatility for 10-year Treasury yields derived by 30-day options on 10-year Treasury futures from the CME. This “CVOL” index is shown below from 1/3/2022 to 5/2/2022.
As the chart shows, implied interest rate volatility has increased significantly over the course of this year, especially since the end of February. This index, btw, is available back to 2014, and with the exception of a very brief period following the onset of the pandemic, implied volatility is at its highest level since at least 2014, and probably longer.
Obviously, an increase in implied volatility of this magnitude would be expected to result in a significant increase in mortgage rates relative to non-callable securities such as Treasuries, which, of course, we have seen.
Finally, the Federal Reserve, which for the last few years has been the largest single purchaser of agency MBS, recently announced that it will stop buying MBS and may even sell some MBS later this year.
The question, then, is that given the flattening of part of the yield curve and the significant increase in interest rate volatility this year, as well as the Federal Reserve’s recently announced intentions have mortgage rates risen “excessively” relative to Treasury rates?
One potential way to answer this question is to look at option-adjusted mortgage to Treasury spreads.
More on this topic later. However, the fact that nominal mortgage to 10-year Treasury spreads have widened considerably this year is not surprising given other developments in fixed-income markets, and there is no reason to expect that they will revert back to some “mean” level.
Note: This article was from housing economist Tom Lawler.