Discover more from CalculatedRisk Newsletter
March Existing Home Sales Forecast and 4th Look at Local Housing Markets
Lawler forecast; Adding Boston, California, Memphis, Minneapolis, Phoenix, and Rhode Island
This is the fourth look at local markets in March. I’m tracking about 30 local housing markets in the US. Some of the 30 markets are states, and some are metropolitan areas. I’ll update these tables throughout the month as additional data is released.
My view is that if the housing market starts slowing, it will show up in inventory first. And we are seeing a change in inventory right now! (Likely due to higher mortgage rates)
The following data is important, especially active inventory. One of the key factors for house prices is supply and tracking local inventory reports will help us understand what is happening with supply.
On a national basis, we saw record low inventory levels over the Winter. Based on the data released to date, it is pretty clear that inventory bottomed seasonally in February. Last year, inventory didn’t bottom until early April.
The next milestone will be when inventory is up year-over-year (YoY). My current guess is inventory will be up YoY near mid-year.
Note that 30-year mortgage rates averaged 4.2% in March according to Freddie Mac. Now rates are around 5.25%.
Lawler: Early Read on Existing Home Sales in March
From housing economist Tom Lawler:
Based on publicly-available local realtor/MLS reports released across the country through today, I project that existing home sales as estimated by the National Association of Realtors ran at a seasonally adjusted annual rate of 5.74 million in March, down 4.7% from February’s preliminary pace and down 5.0% from last March’s seasonally adjusted pace.
Local realtor reports, as well as reports from national inventory trackers, suggest that the YOY % decline in the inventory of existing homes for sale last month was significantly lower than that in February.
Finally, local realtor/MLS reports suggest the median existing single-family home sales price last month was up by about 16.3% from last March.
CR Note: The National Association of Realtors (NAR) is scheduled to release March existing home sales tomorrow, Wednesday, April 20, 2022, at 10:00 AM ET. The consensus is for 5.80 million SAAR.
California Home Sales, Prices and Inventory in March
California doesn’t report monthly sales or inventory, but here is the press release from the California Association of Realtors® (C.A.R.): California home sales tick higher in March as statewide median price sets another all-time high, C.A.R. reports
Closed escrow sales of existing, single-family detached homes in California totaled a seasonally adjusted annualized rate of 426,970 in March, according to information collected by C.A.R. from more than 90 local REALTOR® associations and MLSs statewide. The statewide annualized sales figure represents what would be the total number of homes sold during 2022 if sales maintained the March pace throughout the year. It is adjusted to account for seasonal factors that typically influence home sales.
March’s sales pace ticked up 0.5 percent on a monthly basis from 424,640 in February and was down 4.4 percent from a year ago, when 446,410 homes were sold on an annualized basis. The year-over-year sales decrease was the ninth straight decline and the smallest in eight months. …
California’s median home price reached a new record high in March at $849,080 — surpassing the previous record of $827,940 set in August 2021 and rising above the $800,000 benchmark for the first time in six months. The March price was 11.9 percent higher than the $758,990 recorded last March. The month-to-month percent change in median price was the highest pace since March 2013, and the 10.1 percent increase from February was the first time in nine years that the monthly price increase was in the double-digits. …
Active listings in March climbed to the highest level in five months and posted the first year-over-year gain since June 2019. Newly added listings in March also increased for the first time in nine months, reaching the highest level since August 2021. The month-to-month increase of 37.7 percent in newly added listings was also the highest since May 2020.
emphasis added
Note that inventory was up year-over-year in California.
Active Inventory in March
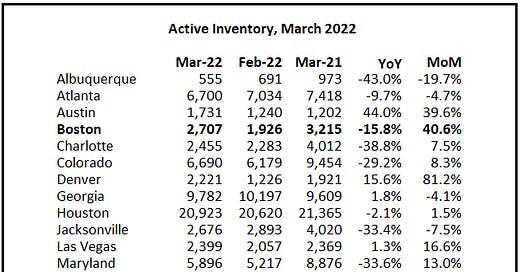
Here is a summary of active listings for these housing markets in March. Note: Inventory usually increases seasonally in March, so the month-over-month (MoM) increase is not surprising.
Inventory was up 9.5% in March MoM from February, and down 15.1% YoY. Inventory in about a third of these markets was already up YoY.
It appears inventory bottomed in February. Last month, these markets were down 23.7% YoY, so this is a significant change from February. This is the first step towards a more balanced market, but inventory levels are still very low.
Notes for all tables:
New additions to table in BOLD.
Northwest (Seattle), North Texas (Dallas) and Santa Clara (San Jose), Jacksonville, Source: Northeast Florida Association of REALTORS®
Totals do not include Atlanta or Denver (included in state totals).
New Listings in March
And here is a table for new listings in March. For these areas, new listings were down 1.1% YoY. We are not seeing a pickup in new listings.
Last month, new listings in these markets were down 2.3% YoY.
Closed Sales in March
And a table of March sales. Sales in these areas were down 5.3% YoY, Not Seasonally Adjusted (NSA). Sales were up YoY in about 30% of these markets.
A few more local markets to come!
March Existing Home Sales Forecast and 4th Look at Local Housing Markets
Hoping you add the Raleigh Market to this list. Thanks.