


NAR: Existing-Home Sales Increased to 3.82 million SAAR in November
Months-of-Supply Close to 2019 Levels

From the NAR: Existing-Home Sales Expanded 0.8% in November, Ending Five-Month Slide
Existing-home sales grew in November, breaking a streak of five consecutive monthly declines, according to the National Association of REALTORS®. Among the four major U.S. regions, sales climbed in the Midwest and South but receded in the Northeast and West. All four regions experienced year-over-year sales decreases.
Total existing-home sales – completed transactions that include single-family homes, townhomes, condominiums and co-ops – elevated 0.8% from October to a seasonally adjusted annual rate of 3.82 million in November. Year-over-year, sales fell 7.3% (down from 4.12 million in November 2022).
...
Total housing inventory registered at the end of November was 1.13 million units, down 1.7% from October but up 0.9% from one year ago (1.12 million). Unsold inventory sits at a 3.5-month supply at the current sales pace, down from 3.6 months in October but up from 3.3 months in November 2022.
emphasis added
The sales rate was above the consensus forecast.
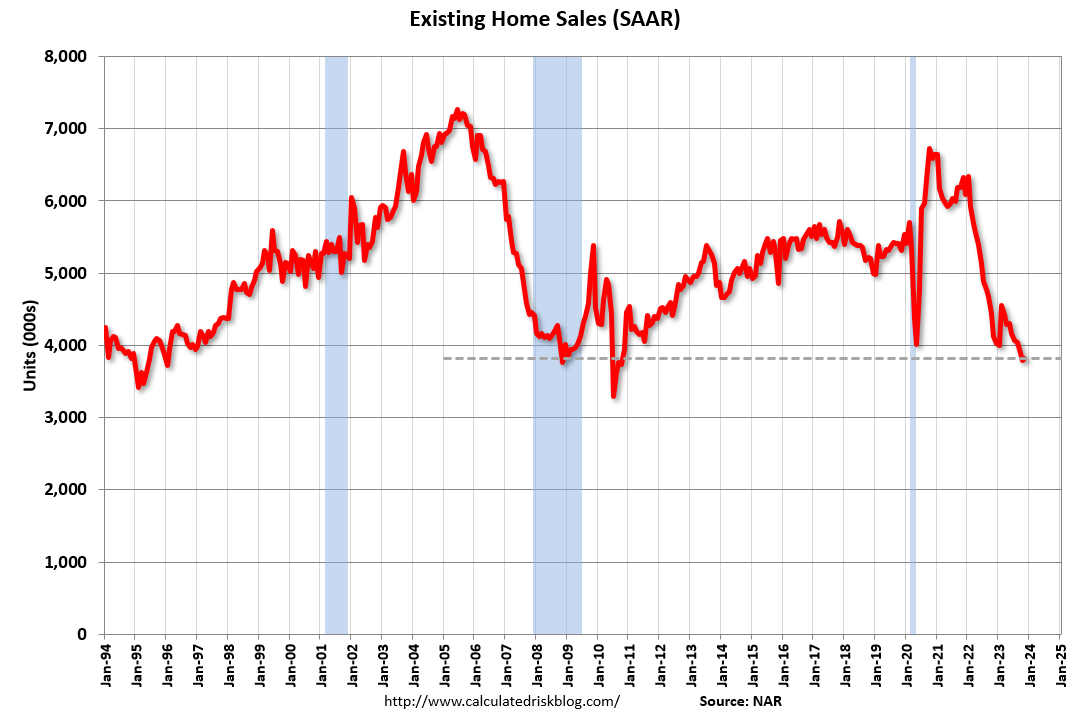
Sales in November (3.82 million SAAR) were up 0.8% from the previous month and were 7.3% below the November 2022 sales rate.
Housing Inventory Decreased Seasonally in November
The second graph shows nationwide inventory for existing homes.
According to the NAR, inventory decreased to 1.13 million in November from 1.15 million the previous month.

Headline inventory is not seasonally adjusted, and inventory usually decreases to the seasonal lows in December and January, and peaks in mid-to-late summer. The third graph shows the year-over-year (YoY) change in reported existing home inventory and months-of-supply. Since inventory is not seasonally adjusted, it really helps to look at the YoY change. Note: Months-of-supply is based on the seasonally adjusted sales and not seasonally adjusted inventory.

Inventory was up 0.9% year-over-year (blue) in November compared to November 2022. Months of supply (red) decreased to 3.5 months in November from 3.6 months the previous month.
In November 2019, months of supply was at 3.7 months, so this is fairly close to pre-pandemic levels - due to a sharp decline in both sales and inventory.
Sales Year-over-Year and Not Seasonally Adjusted (NSA)
The fourth graph shows existing home sales by month for 2022 and 2023.
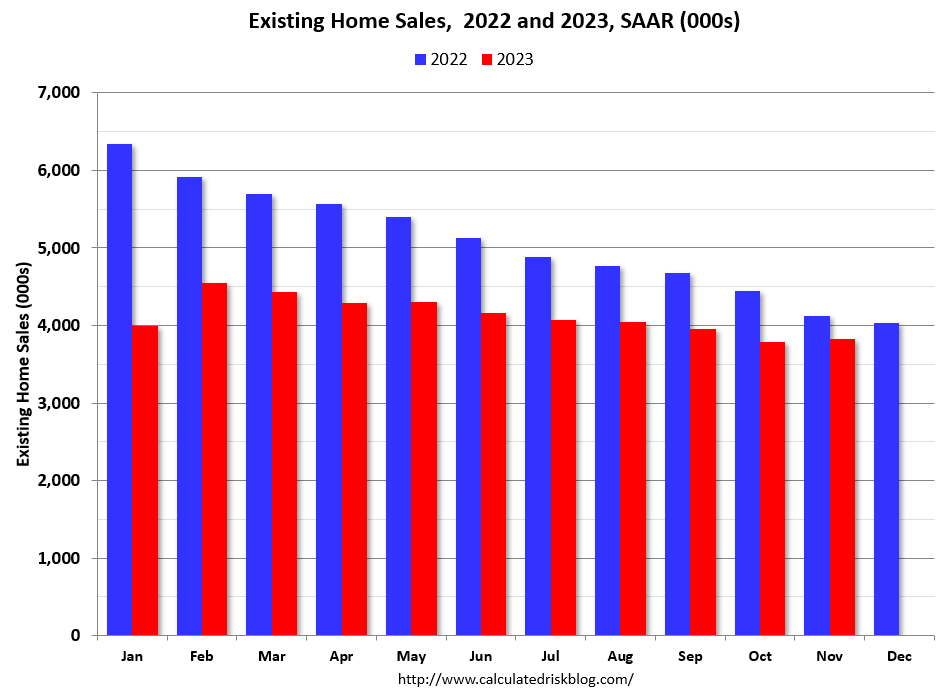
Sales declined 7.3% year-over-year compared to November 2022. This was the twenty-seventh consecutive month with sales down year-over-year. This was just above the cycle low of 3.79 million SAAR last month.
Keep reading with a 7-day free trial
Subscribe to CalculatedRisk Newsletter to keep reading this post and get 7 days of free access to the full post archives.