Pace of Rent Increases Continues to Slow
Higher Rents will continue to impact measures of inflation in 2022
Another monthly update on rents. First, from ApartmentList.com: Apartment List National Rent Report
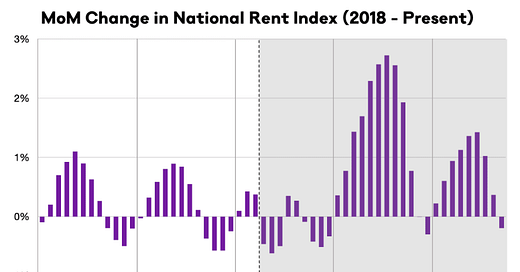
Welcome to the October 2022 Apartment List National Rent Report. Our national index fell by 0.2 percent over the course of September, marking the first time this year that the national median rent has declined month-over-month. The timing of this slight dip in rents is consistent with a seasonal trend that was typical in pre-pandemic years. Assuming that trend continues, it is likely that rents will continue falling in the coming months as we enter the winter slow season for the rental market. … Year-over-year growth is continuing to decelerate, and now stands at 7.5 percent, down from a peak of nearly 18 percent at the beginning of the year.
This cooldown in rent growth is being mirrored by continued easing on the supply side of the market. Our vacancy index now stands at 5.2 percent, after nearly a year of gradual increases from a low of 4.1 percent last fall. That said, today’s vacancy rate remains well below the pre-pandemic norm, and spiking mortgage rates that continue sidelining first-time homebuyers could contribute additional tightness to the rental market.
emphasis added
Rents are now decreasing seasonally.
From Realtor.com: August Rental Report: Affordability Continues to Worsen
In August 2022, the U.S. rental market experienced its first single-digit growth over the past 13 months. The median rent growth across the top 50 metros slowed to 9.8% year-over-year for 0-2 bedroom properties but is still three times as fast as the growth rate seen just before the pandemic hit in March 2020. The median asking rent was $1,771, down by $10 from last month. It is the first time we have seen rents decline since last November, perhaps a sign that more typical seasonal cooling is returning to the rental market, like we’ve seen in recent for-sale data.
CoreLogic also tracks rents for single family homes: Annual US Single-Family Rent Growth Holds CoreLogic: Annual US Rent Price Growth Slows for Third Consecutive Month in July
CoreLogic … today released its latest Single-Family Rent Index (SFRI), which analyzes single-family rent price changes nationally and across major metropolitan areas.
Although U.S. single-family rent growth was up by 12.6% in July year over year, the gains continued to slow from the historic high recorded in April. CoreLogic observes similar price growth relaxation in most major metro areas tracked in the SFRI, including popular Sun Belt cities that have seen rental costs skyrocket. Miami’s 30.6% annual price gain again topped the country in July but is down from the 40.8% year-over-year growth recorded in March 2022. Phoenix, which posted a 12.2% annual gain in July, saw rental cost growth drop by 6 percentage points from March. Large rent price increases in major Sun Belt metros over the past year have eroded affordability, making these areas less attractive to people who may have been considering migrating and thereby tempering demand. …
“July marked the third month of slower annual gains in single-family rents,” said Molly Boesel, principal economist at CoreLogic. “However, higher interest rates this year increased monthly mortgage payments for new loans, and potential homebuyers may choose to continue renting rather than buy, helping keep price increases in check.”
The 12.6% YoY increase in July was the down from 13.4% in June.
Rent Data
I’m going to update some of the data on rents. Here is a graph of several measures of rent since 2000: OER, rent of shelter, rent of primary residence, Zillow Observed Rent Index (ZORI), and ApartmentList.com. (All set to 100 in January 2017)
Note: For a discussion on how OER, and Rent of primary residence are measured, see from the BLS: How the CPI measures price change of Owners’ equivalent rent of primary residence (OER) and rent of primary residence (Rent)
OER, rent of shelter, and rent of primary residence have mostly moved together. The Zillow index started in 2014, and the ApartmentList index started in 2017.
Here is a graph of the year-over-year (YoY) change for these measures since January 2015. All of these measures are through August 2022 (Apartment List through September 2022).
Note that new lease measures (Zillow, Apartment List) dipped early in the pandemic, whereas the BLS measures were steady. Then new leases took off, and the BLS measures are picking up.
The Zillow measure is up 12.3% YoY in August, down from 13.8% YoY in July. This is down from a peak of 17.2% YoY in February.
The ApartmentList measure is up 7.5% YoY as of September, down from 9.8% in August. This is down from the peak of 18.0% YoY last November.
Both the Zillow measure (a repeat rent index), and ApartmentList are showing a slowdown in rental increases in rents. From Zillow:
“ZORI is a repeat-rent index that is weighted to the rental housing stock to ensure representativeness across the entire market, not just those homes currently listed for-rent.”
And from ApartmentList:
At Apartment List, we estimate the median contract rent across new leases signed in a given market and month. To capture how rents change in a market over time, we estimate the expected price change that a rental unit should experience if it were to be leased today.
Both of these measures reflect new leases, whereas most rental units don’t turnover every year (as captured by the BLS measures). This sharp increase in new lease rates should spill over into the consumer price index over the next year (as discussed in earlier article).
Rents are still increasing, and we should expect this to continue to spill over into measures of inflation. The Owners’ Equivalent Rent (OER) was up 6.3% YoY in August, from 5.8% YoY in July - and will likely increase further in the coming months.
Conclusion
My suspicion is rent increases will slow further over the coming months as the pace of household formation slows, and more supply comes on the market.