Part 1: Current State of the Housing Market; Overview for mid-June 2025
This 2-part overview for mid-June provides a snapshot of the current housing market.
First, a quote from Toll Brothers CEO Douglas Yearley Jr.:
“The spring selling season, which is really a winter selling season, is when most new homes are sold in this country. It's mid January until the end of April, and the reason for that is most people want to move into their new home for the next school year. So you [homebuilders] better get [the buyer] under contract and get it going in February, March, April, to have it completed by the school year. That's what provides for our business. And this was not a good spring.”
emphasis added
It was not a “good Spring” for new homebuilders, but it wasn’t horrible. However, homebuilders have a growing number of completed homes for sales, a larger than normal number of unsold homes under construction and are competing with more existing home inventory.
And the key stories for existing homes are that inventory is increasing sharply, and sales are essentially flat compared to last year (and sales in 2024 were the lowest since 1995). That means prices will be under pressure (although there will not be a huge wave of distressed sales).
New Listings for Existing Homes Up Year-over-year in May
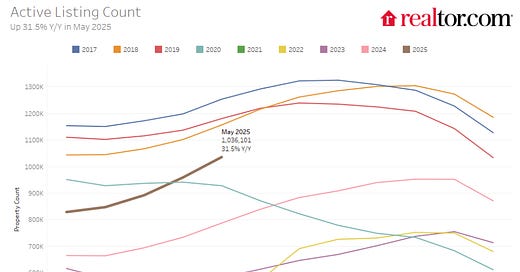
Realtor.com reports in the May 2025 Monthly Housing Market Trends Report that new listings were up 7.2% year-over-year in May. And active listings were up 31.5% year-over-year.
Homebuyers found more options in May, as the number of actively listed homes rose 31.5% compared to the same time last year. This builds on April’s 30.6% increase and marks the 19th consecutive month of year-over-year inventory gains. The number of homes for sale topped 1 million for the first time since Winter 2019 and exceeded 2020 levels for the second month in a row, a key pandemic recovery benchmark. Still, inventory remains 14.4% below typical 2017–2019 levels, though May’s gains indicate the market is closing the gap at an accelerating pace.
Note the seasonality for active listings. The next few months will be the key for inventory, and it now appears inventory will be back to 2019 levels by the end of 2025.
The following content is for paid subscribers only. Thanks to all paid subscribers!
Keep reading with a 7-day free trial
Subscribe to CalculatedRisk Newsletter to keep reading this post and get 7 days of free access to the full post archives.


