
Part 1: Current State of the Housing Market; Overview for mid-November 2025

This 2-part overview for mid-November provides a snapshot of the current housing market.
Note that we are missing some key pieces of data due to the government shutdown, such as housing starts and new home sales. However, most other housing data, like existing home inventory and house prices, are available from private sources.
The key stories this year for existing homes are that inventory increased sharply, and sales are down slightly compared to last year (and sales in 2024 were the lowest since 1995). That means prices are under pressure (although there will not be a huge wave of distressed sales). It now appears likely that existing home prices will be down nationally year-over-year by the end of 2025.
It has also been a disappointing year for new homebuilders (but not as horrible as the housing bust!). Homebuilders have a growing number of completed homes for sales, a larger than normal number of unsold homes under construction and are reducing prices to compete with more existing home inventory.
Active Listings for Existing Homes Up Year-over-year
Realtor.com reports in the October 2025 Monthly Housing Market Trends Report that new listings were up 5.1% year-over-year in October. And active listings were up 15.3% year-over-year.
Homebuyers found more options in October, as the number of actively listed homes rose 15.3% compared to the same time last year. While this marks the 24th consecutive month of year-on-year inventory gains, active listing growth has slowed in each of the past five months (down from 17% in September, 20.9% in August, 24.8% in July, 28.9% in June, and 31.5% in May). The number of homes for sale topped 1 million for the sixth consecutive month, unchanged since July. Still, nationwide October inventory remains 13.2% belowtypical 2017–19 levels, about the same as last month, an indication that the nationwide inventory recovery has stalled.
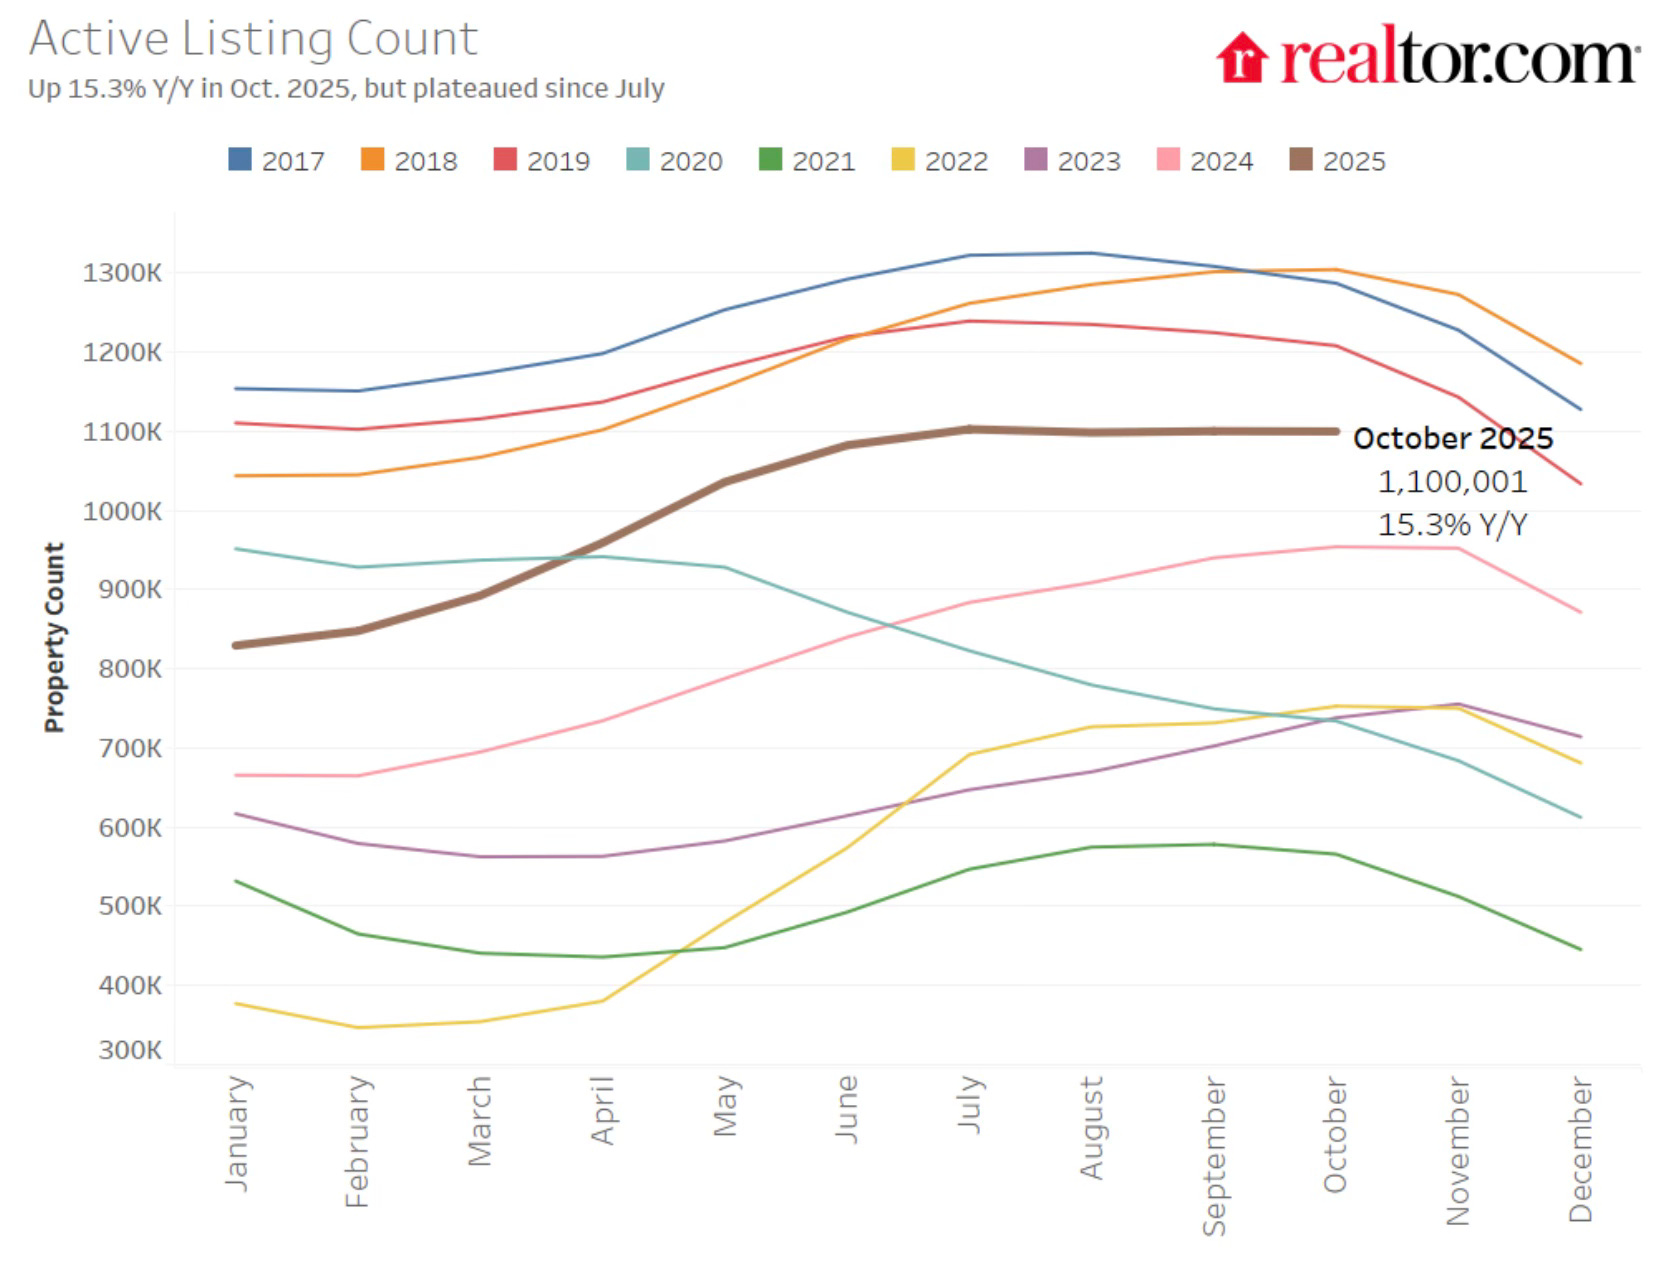
Note the seasonality for active listings. It appears inventory will still be below 2019 levels at the end of 2025.
Here is some more data on supply and sales.
The following content is for paid subscribers only. Thanks to all paid subscribers!
Keep reading with a 7-day free trial
Subscribe to CalculatedRisk Newsletter to keep reading this post and get 7 days of free access to the full post archives.