This 2-part overview for mid-November provides a snapshot of the current housing market.
I always focus first on inventory, since inventory usually tells the tale! I’m watching months-of-supply closely.
New Listings for Existing Homes Up Year-over-year in October
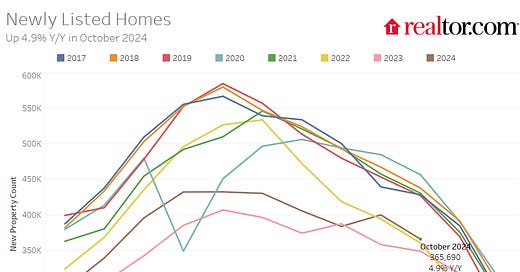
Here is a graph of new listing from Realtor.com’s October 2024 Monthly Housing Market Trends Report showing new listings were up 4.9% year-over-year in October. New listings are still well below pre-pandemic levels. From Realtor.com:
Sellers continued to increase their activity this October as newly listed homes were 4.9% above last year’s levels, a sharp decrease from September’s rise of 11.6% but still up from August’s 0.9% decrease. We noted last month that the sharp decrease in mortgage rates in mid-August could lead to an increase in listings in the coming months as lower rates begin to entice the marginal homeowner to sell, and that’s exactly what happened in September and October. November and December are usually some of the colder months in the housing market, but it’s possible we’ll also see an increase in listing activity in these months after the uncertainty of the presidential election subsides.
Note the seasonality for new listings. December and January are seasonally the weakest months of the year for new listings, followed by February and November. New listings will be up year-over-year in 2024, but still well below normal levels.
Hurricane Milton depressed new listings and sales in Florida in October (we are seeing that in the local markets I follow).
Impact on Active Inventory
The following content is for paid subscribers only. Thanks to all paid subscribers!
Keep reading with a 7-day free trial
Subscribe to CalculatedRisk Newsletter to keep reading this post and get 7 days of free access to the full post archives.


