

Yesterday, in Part 1: Current State of the Housing Market; Overview for mid-February 2026 I reviewed home inventory and sales. I noted that the key stories this year for existing homes are that months-of-supply was at pre-pandemic levels, while sales in 2025 were at the lowest level since 1995 (tying 2024). That means prices are under pressure, especially in areas with high levels of inventory, although we will NOT see cascading price declines like during the housing bust, since there will not be a huge wave of distressed sales. Most homeowners have substantial equity and low mortgage rates.
In Part 2, I will look at house prices, mortgage rates, rents and more.
In general, house prices were mostly unchanged year-over-year at the end of 2025. Lower mortgage rates have led to a pickup in purchase mortgage applications recently, but this hasn’t led to significantly more sales, at least not yet.
House Prices
The Case-Shiller National Index increased 1.4% year-over-year (YoY) in November and will likely be about the same or slightly lower year-over-year in the December report compared to November (based on other data).
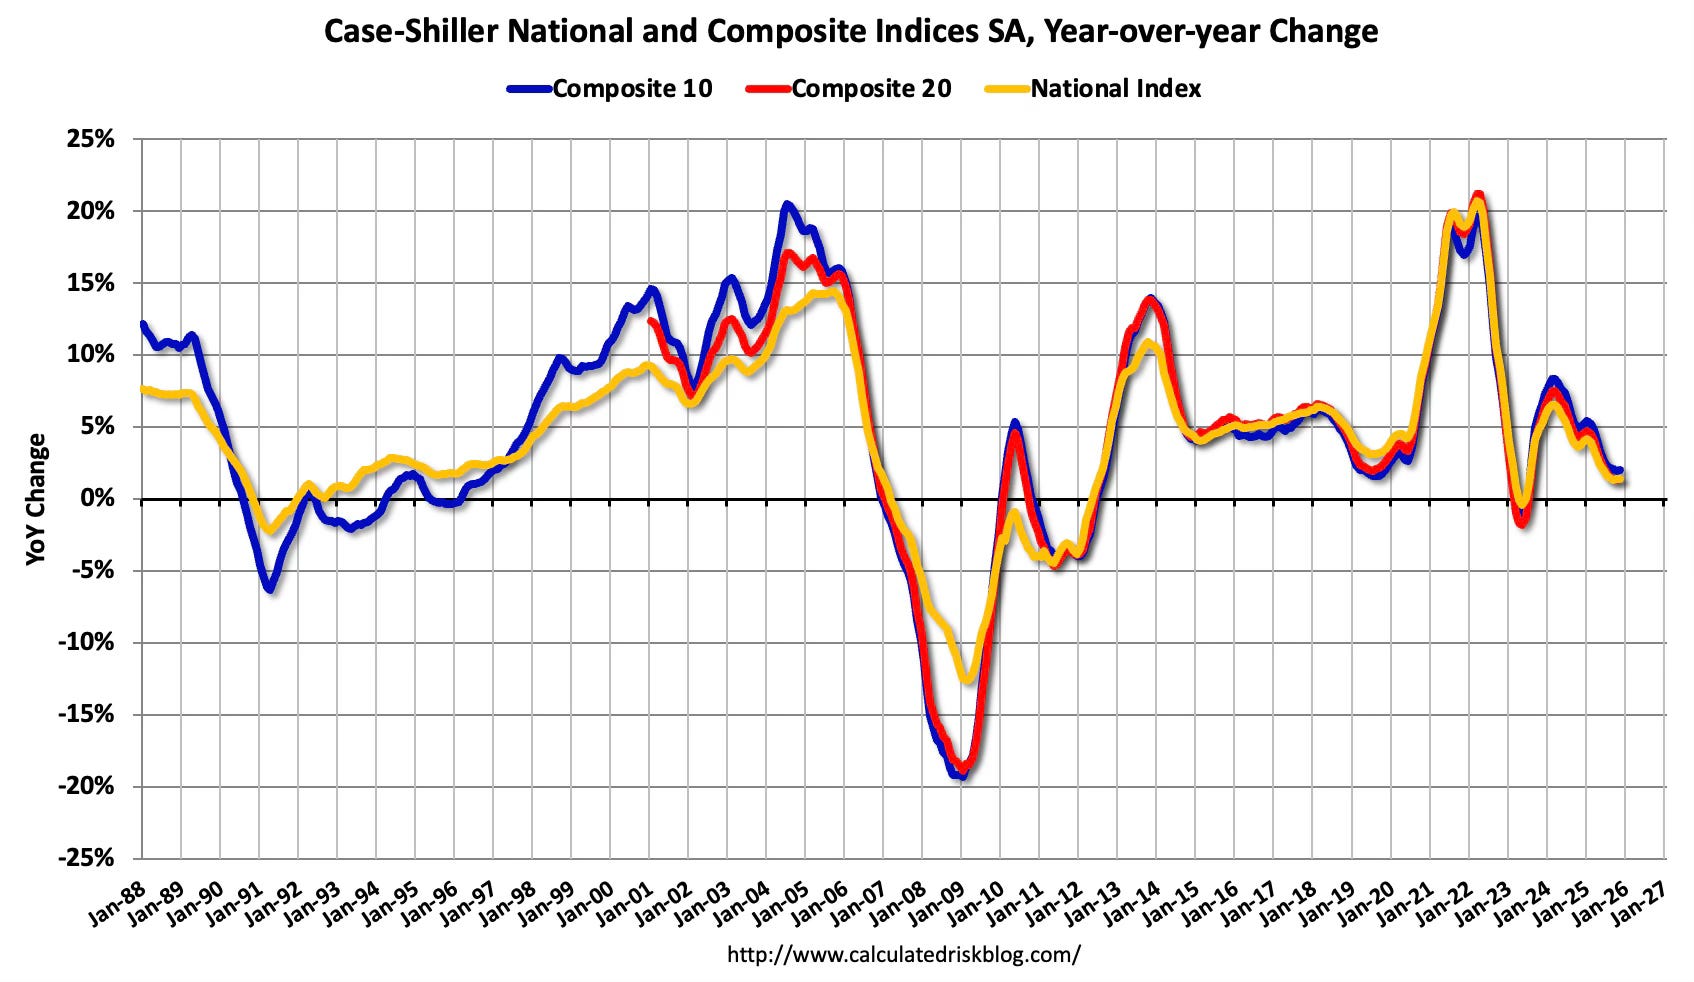
The Composite 10 NSA was up 2.0% year-over-year. The Composite 20 NSA was up 1.4% year-over-year. The National index NSA was up 1.4% year-over-year.
The National index increased 0.40% month-over-month (MoM). This is the 4th consecutive month with a MoM increase seasonally adjusted that followed 5 consecutive months with a MoM decline.
The November Case-Shiller index was a 3-month average of closing prices in September, October and November. September closing prices include some contracts signed in July. So, not only is the year-over-year change trending down, but there is a significant lag to this data.
Let’s review some more timely house price data …
The following content is for paid subscribers only. Thanks to all paid subscribers!