


Q1 Update: Delinquencies, Foreclosures and REO
REO: lender Real Estate Owned

We will NOT see a surge in foreclosures that would significantly impact house prices (as happened following the housing bubble) for two key reasons: 1) mortgage lending has been solid, and 2) most homeowners have substantial equity in their homes. With substantial equity, and low mortgage rates (mostly at a fixed rates), few homeowners will have financial difficulties.
But it is still important to track delinquencies and foreclosures.
Here is some data on REOs through Q1 2025 …
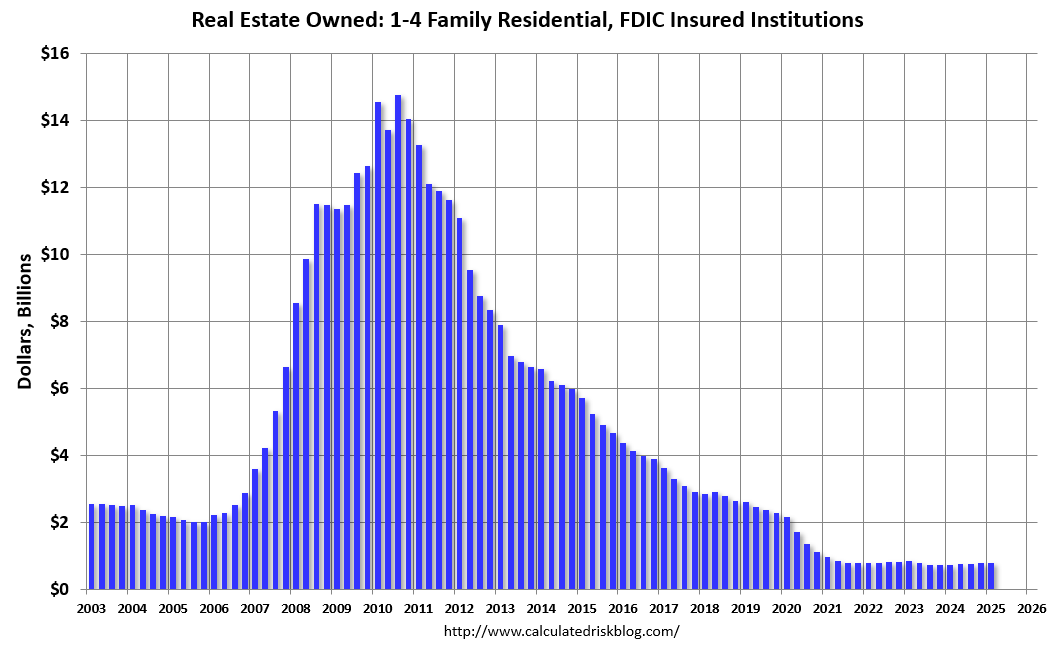
This graph shows the nominal dollar value of Residential REO for FDIC insured institutions based on the Q1 FDIC Quarterly Banking Profile released last week. Note: The FDIC reports the dollar value and not the total number of REOs.
The dollar value of 1-4 family residential Real Estate Owned (REOs, foreclosure houses) was up 5% YOY from $742 million in Q1 2024 to $784 million in Q1 2025. This is historically extremely low.
Fannie Mae reported the number of REOs decreased to 5,236 at the end of Q1 2025, down 11% from 5,895 at the end of the previous quarter, and down 34% year-over-year from 7,971 in Q1 2024. Here is a graph of Fannie Real Estate Owned (REO).

This is very low and well below the pre-pandemic levels. REOs are a lagging indicator. REOs increase when borrowers struggle financially and have little or no equity, so they can’t sell their homes - as happened after the housing bubble. That will not happen this time.
Here is some data on delinquencies …
It is important to note that loans in forbearance are counted as delinquent in the various surveys but not reported to the credit agencies.
Here is a graph from the MBA’s National Delinquency Survey through Q1 2025.

The percent of loans in the foreclosure process increased year-over-year from 0.46 percent in Q1 2024 to 0.49 percent in Q1 2025 (red) but remains historically low. Loans in forbearance are mostly in the 90-day bucket at this point, and that has declined recently. From the MBA:
Compared to last quarter, the seasonally adjusted mortgage delinquency rate increased for all loans outstanding. By stage, the 30-day delinquency rate increased 11 basis points to 2.14 percent, the 60-day delinquency rate decreased 3 basis points to 0.73 percent, and the 90-day delinquency bucket decreased 2 basis points to 1.17 percent. ...
The delinquency rate includes loans that are at least one payment past due but does not include loans in the process of foreclosure. The percentage of loans in the foreclosure process at the end of the first quarter was 0.49 percent, up 4 basis points from the fourth quarter of 2024 and 3 basis points higher than one year ago. emphasis added
Both Fannie and Freddie release serious delinquency (90+ days) data monthly. Freddie Mac reported that the Single-Family serious delinquency rate in April was 0.57%, down from 0.59% March. Freddie's rate is up year-over-year from 0.51% in April 2024, however, this is close to the pre-pandemic level of 0.60%. Freddie's serious delinquency rate peaked in February 2010 at 4.20% following the housing bubble and peaked at 3.17% in August 2020 during the pandemic.
Fannie Mae reported that the Single-Family serious delinquency rate in March was 0.55%, down from 0.56% in March. The serious delinquency rate is up year-over-year from 0.49% in April 2024, however, this is below the pre-pandemic lows of 0.65%. The Fannie Mae serious delinquency rate peaked in February 2010 at 5.59% following the housing bubble and peaked at 3.32% in August 2020 during the pandemic.
This graph shows the recent decline in serious delinquencies:

The pandemic related increase in serious delinquencies was very different from the increase in delinquencies following the housing bubble. Lending standards have been fairly solid over the last decade, and most of these homeowners have equity in their homes - and they have been able to restructure their loans once they were employed.
And on foreclosures …
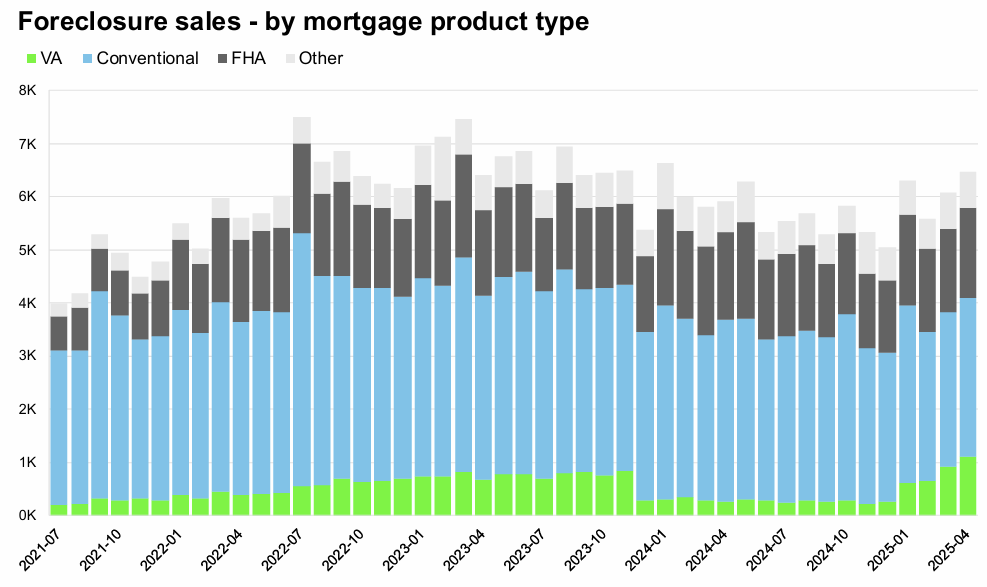
ICE reported that active foreclosures are still very low but have increased recently. have decreased and are near the records. From ICE: ICE June Mortgage Monitor report
A wider scope shows that while mortgage performance still remains historically strong, delinquency and foreclosure metrics are gradually trending higher on a year-over-year basis
Foreclosure starts (+13%), sales (+9%), and active inventory (+4%) all rose YoY for the second consecutive month
April’s 6,500 foreclosure sales marked the largest single-month volume in 15 months, with VA sales, which account for the bulk of the recent rise, hitting their highest level since 2019
The bottom line is there will not be a huge wave of foreclosures as happened following the housing bubble. The distressed sales during the housing bust led to cascading price declines, and that will not happen this time.