Discover more from CalculatedRisk Newsletter
The rental market has changed significantly.
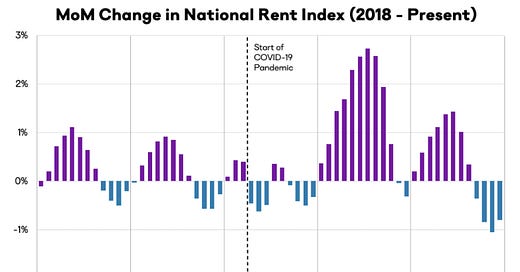
Rental Data shows Faster Decline than "Seasonality Alone"
From ApartmentList.com: Apartment List National Rent Report
Welcome to the first Apartment List National Rent Report of 2023. Our national index fell by 0.8 percent over the course of December, marking the fourth straight month-over-month decline. The timing of this cooldown in the rental market is consistent with the typical seasonal trend, but its magnitude has been notably sharper than what we’ve seen in the past. This suggests that the recent swing to falling rents is reflective of a broader shift in market conditions beyond seasonality alone. As we look ahead to the new year, we expect that 2023 will see bargaining power shift back to renters, and that rent prices this year will grow only modestly, if at all.
Over the course of 2022 as a whole, the national median rent increased by a total of 3.8 percent. This means that last year represented a return to pre-pandemic levels of rent growth, after the astronomical 17.6 percent spike in rents that we saw in 2021. Rent growth in 2022 still ranks as the second fastest year in the history of our estimates (going back to 2017), but it came in just barely ahead of the 3.5 percent rate from 2018.
Our vacancy index spiked above 7 percent in the early months of the pandemic in 2020, as many Americans consolidated households and moved in with family amid the uncertainty and economic disruption of the pandemic’s onset. After that, however, rapid household formation drove a sharp tightening of the vacancy rate, which eventually fell to a low of 4.1 percent last fall.
But after bottoming out at 4.1 percent in October 2021, our national vacancy index has been on a trend of gradual easing for over a year. And the pace at which the vacancy rate is easing has been picking up a bit of steam in recent months, as rent growth has turned negative. In the four months from April through August, our vacancy index ticked up by a total of just 0.2 percentage points, from 4.9 percent to 5.1 percent. But in the most recent four months from August through November, it has increased by 0.8 percentage points, reaching 5.9 percent this month.
emphasis added
Rents appear to be decreasing more than just seasonally.
From Realtor.com: November Rental Report: Rent Falls for the Fourth Straight Month
In November 2022, the U.S. rental market experienced single-digit growth for the fourth month in a row after ten months of slowing from January’s peak 17.4% growth. The median rent growth across the top 50 metros slowed to 3.4% year-over-year for 0-2 bedroom properties, the lowest growth rate in 19 months. The median asking rent was $1,712, down by $22 from last month and $69 from the peak but is still $308 (21.9%) higher than the same time in 2019 (pre-pandemic).
CoreLogic also tracks rents for single family homes: Annual US Single-Family Rent Price Growth Falls to Single Digits in October, CoreLogic Reports
U.S. rental price growth slowed for the sixth straight month on an annual basis in October to 8.8%, the lowest rate of appreciation in more than a year but still three times higher than the pre-pandemic level. Despite the continued cooling, a shortage of available properties is keeping costs elevated, a trend that is partially fueling year-over-year gains in the lower-priced tier. Miami led the nation for rent growth for the 15th consecutive month at 16.3%, but gains there have slowed dramatically since the spring when they hit 40.8%.
“Single-family rents decreased again on a monthly basis in October but were still up year over year,” said Molly Boesel, principal economist at CoreLogic. “While rents typically experience a seasonal decline in October, this year’s decrease was larger than average and could point to prices slowing more sharply than expected in the coming months.”
The 8.8% YoY increase in October was down from 10.2% in September.
Yesterday I posted some data from Moody’s analytics: Moody's: National Multifamily Supply and Demand at Lowest Levels since 2009
Rent Data
I’m going to update some of the data on rents. Here is a graph of several measures of rent since 2000: OER, rent of primary residence, Zillow Observed Rent Index (ZORI), ApartmentList.com and CoreLogic Single Family Rental Index (All set to 100 in January 2017)
Note: For a discussion on how OER, and Rent of primary residence are measured, see from the BLS: How the CPI measures price change of Owners’ equivalent rent of primary residence (OER) and rent of primary residence (Rent)
OER and rent of primary residence have mostly moved together. The Zillow index started in 2014, the ApartmentList index started in 2017, and CoreLogic in 2004.
Here is a graph of the year-over-year (YoY) change for these measures since January 2015. Most of these measures are through November 2022, except CoreLogic is through October and Apartment List is through December 2022.
Note that new lease measures (Zillow, Apartment List) dipped early in the pandemic, whereas the BLS measures were steady. Then new leases took off, and the BLS measures are picking up.
The CoreLogic measure is up 8.8% YoY in October, down from 10.2% in September, and down from a peak of 13.9% in April 2022.
The Zillow measure is up 8.4% YoY in November, down from 9.6% YoY in October, and down from a peak of 17.1% YoY in February 2022.
The ApartmentList measure is up 3.9% YoY as of December, down from 4.5% in November, and down from a peak of 18.1% YoY November 2021.
Both the Zillow measure (a repeat rent index), and ApartmentList are showing a slowdown in rental increases in rents. From Zillow:
“ZORI is a repeat-rent index that is weighted to the rental housing stock to ensure representativeness across the entire market, not just those homes currently listed for-rent.”
And from ApartmentList:
At Apartment List, we estimate the median contract rent across new leases signed in a given market and month. To capture how rents change in a market over time, we estimate the expected price change that a rental unit should experience if it were to be leased today.
Both of these measures reflect new leases, whereas most rental units don’t turnover every year (as captured by the BLS measures). The sharp increase in new lease rates in 2021 and early 2022 is spilling over into the consumer price index now (as discussed in earlier article).
Rents are still increasing YoY, and we should expect this to continue to spill over into measures of inflation. The Owners’ Equivalent Rent (OER) was up 7.1% YoY in November, from 6.9% YoY in October - and will likely increase further in the coming months even as rents slow sharply.
Conclusion
My suspicion is rent increases will slow further over the coming months as the pace of household formation slows, and more supply comes on the market. It is possible that we will see a year-over-year decline in rents sometime next year.
This decline in rents has implications for monetary policy. This graph shows the year-over-year change in Core CPI ex-Shelter (blue), and the one month change annualized (red). The year-over-year change was at 5.2% in November, down from 5.9% in October, and down from a peak of 7.6% YoY in February. And the annualized one-month change was negative in both October and November! If the CPI report for December shows a similar slowdown in core CPI ex-shelter, perhaps monetary policy should be adjusted.