


September Housing Starts: Near Record Number of Multi-Family Housing Units Under Construction
Housing Starts Increased to 1.358 million Annual Rate in September

Housing Starts Increased to 1.358 million Annual Rate in September
From the Census Bureau: Permits, Starts and Completions
Housing Starts:
Privately‐owned housing starts in September were at a seasonally adjusted annual rate of 1,358,000. This is 7.0 percent above the revised August estimate of 1,269,000, but is 7.2 percent below the September 2022 rate of 1,463,000. Single‐family housing starts in September were at a rate of 963,000; this is 3.2 percent above the revised August figure of 933,000. The September rate for units in buildings with five units or more was 383,000.
Building Permits:
Privately‐owned housing units authorized by building permits in September were at a seasonally adjusted annual rate of 1,473,000. This is 4.4 percent below the revised August rate of 1,541,000 and is 7.2 percent below the September 2022 rate of 1,588,000. Single‐family authorizations in September were at a rate of 965,000; this is 1.8 percent above the revised August figure of 948,000. Authorizations of units in buildings with five units or more were at a rate of 459,000 in September.
emphasis added
The first graph shows single and multi-family housing starts since 2000 (including housing bubble).

Multi-family starts (blue, 2+ units) increased in September compared to August. Multi-family starts were down 31.4% year-over-year in September. Single-family starts (red) increased in September and were up 8.6% year-over-year.
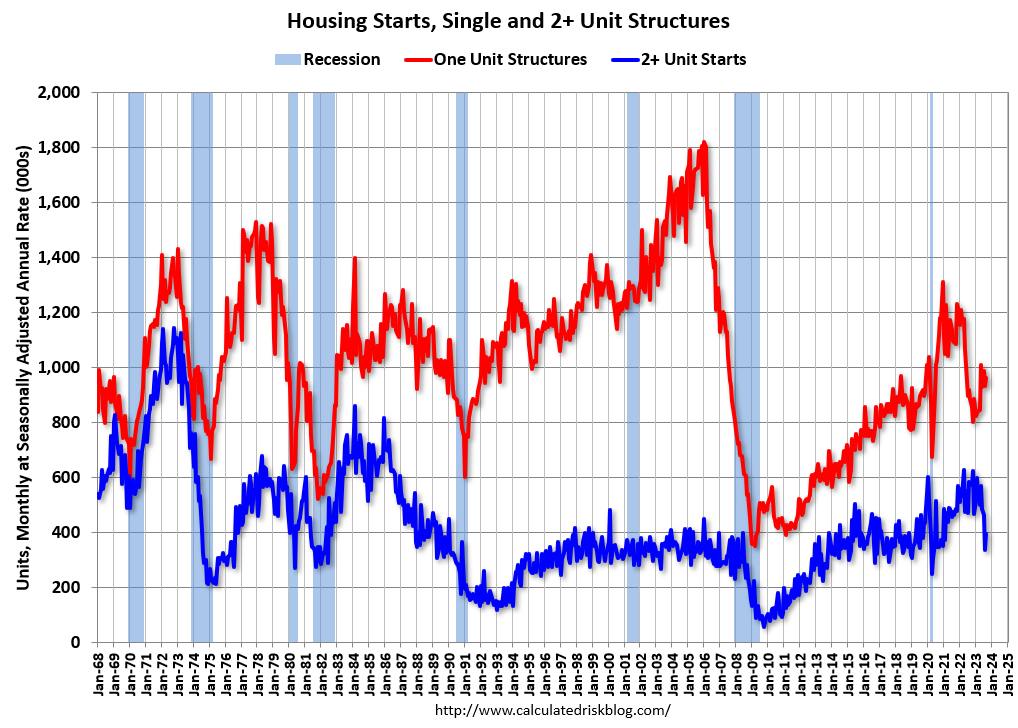
Note that the weakness in 2022 and early 2023 had been in single family starts (red), however the weakness is moving to multi-family now while single family has bounced back somewhat from the bottom.
The second graph shows single and multi-family starts since 1968. This shows the huge collapse following the housing bubble, and then the eventual recovery - and the recent collapse in single-family starts.
Total housing starts in September were below expectations and starts in July and August were revised down slightly, combined.
The third graph shows the month-to-month comparison for total starts between 2022 (blue) and 2023 (red).

Total starts were down 7.2% in September compared to September 2022. And starts year-to-date are down 12.1% compared to last year.
Starts have been down year-over-year for 15 of the last 17 months (May and July 2023 were the exceptions), and total starts will be down this year - although the year-over-year comparisons will be somewhat easier in Q4.
Near Record Number of Multi-Family Housing Units Under Construction
Keep reading with a 7-day free trial
Subscribe to CalculatedRisk Newsletter to keep reading this post and get 7 days of free access to the full post archives.