
Single Family Inventory Up Slightly Year-over-year
Purchase Applications Down Year-over-year

Here are two pieces of weekly data that I follow.
First, here is some timely data from Altos Research on active single-family inventory. This graph shows the seasonal pattern for active single-family inventory since 2015 through last Friday (July 31st).
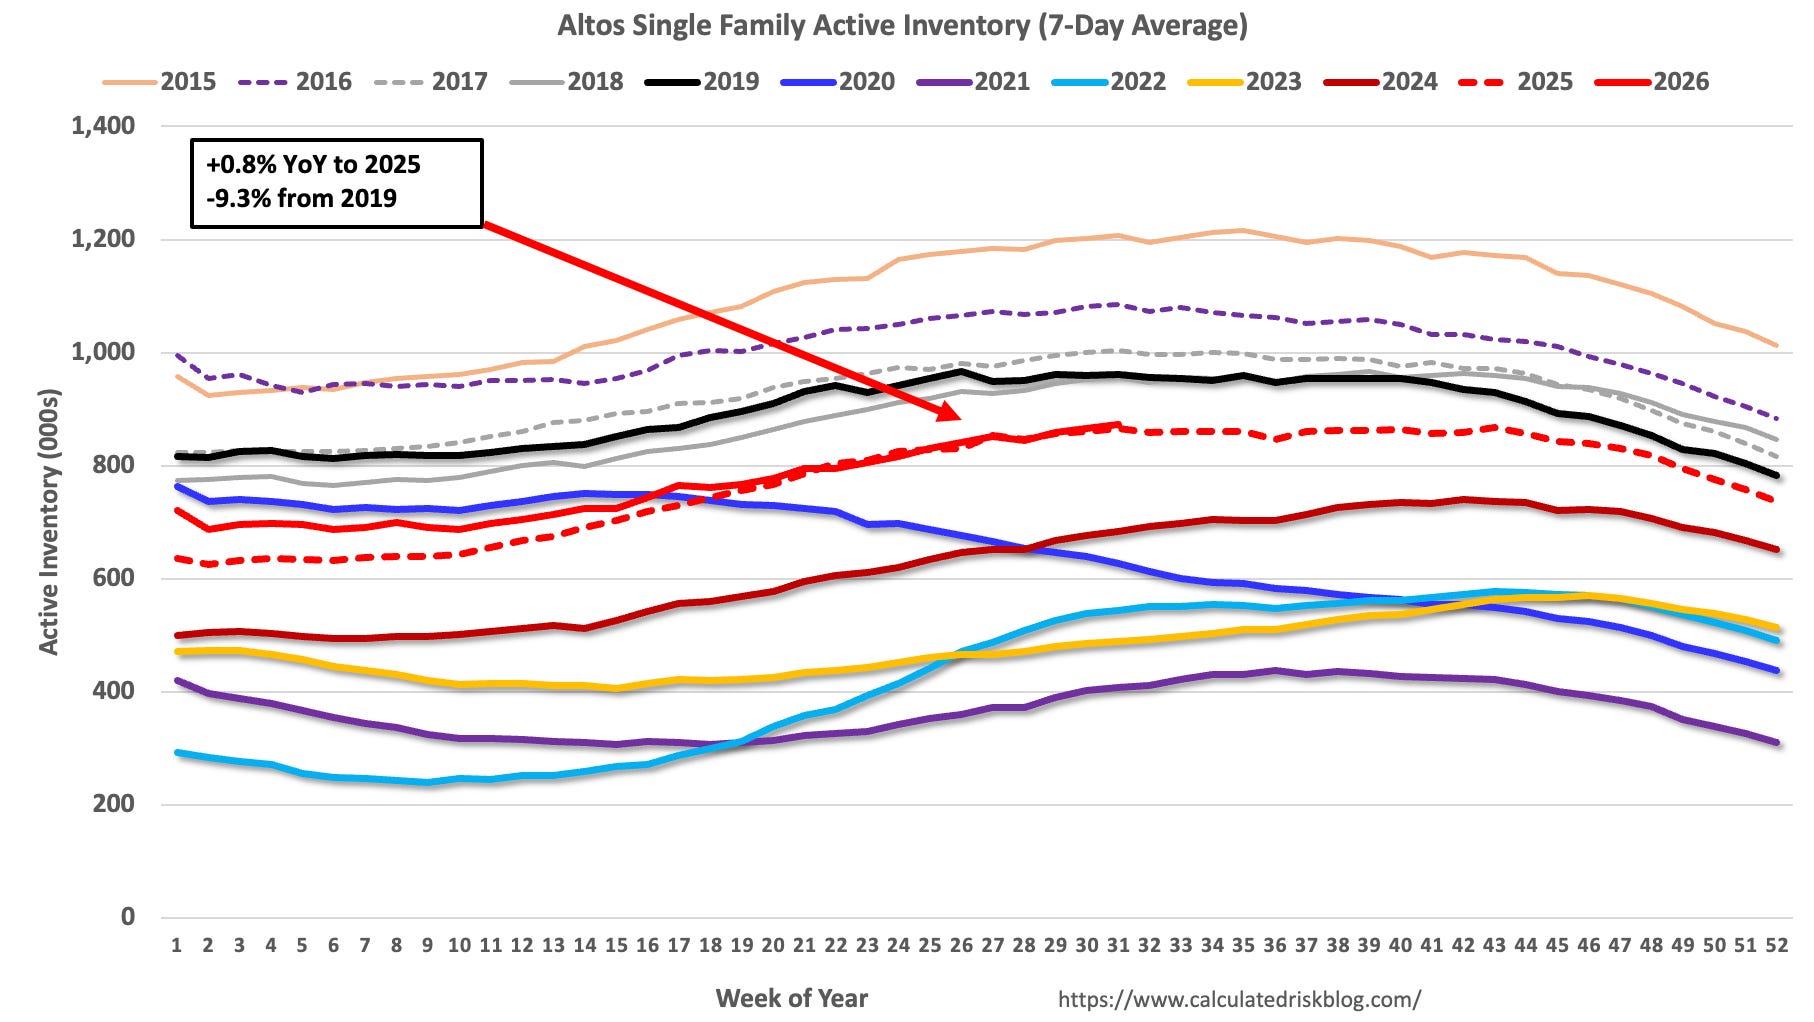
The red line is for 2025. The black line is for 2019.
Inventory was up 0.8% compared to the same week in 2025 (the previous week it was up 0.6%), and down 9.3% compared to the same week in 2019 (last week it was down 9.8%).
This slowdown in inventory growth is a key story in 2026.
Another metric that Altos reports is the median list price. This graph from Altos shows the median list price since 2021. The 7-day median list price is down slightly year-over-year.
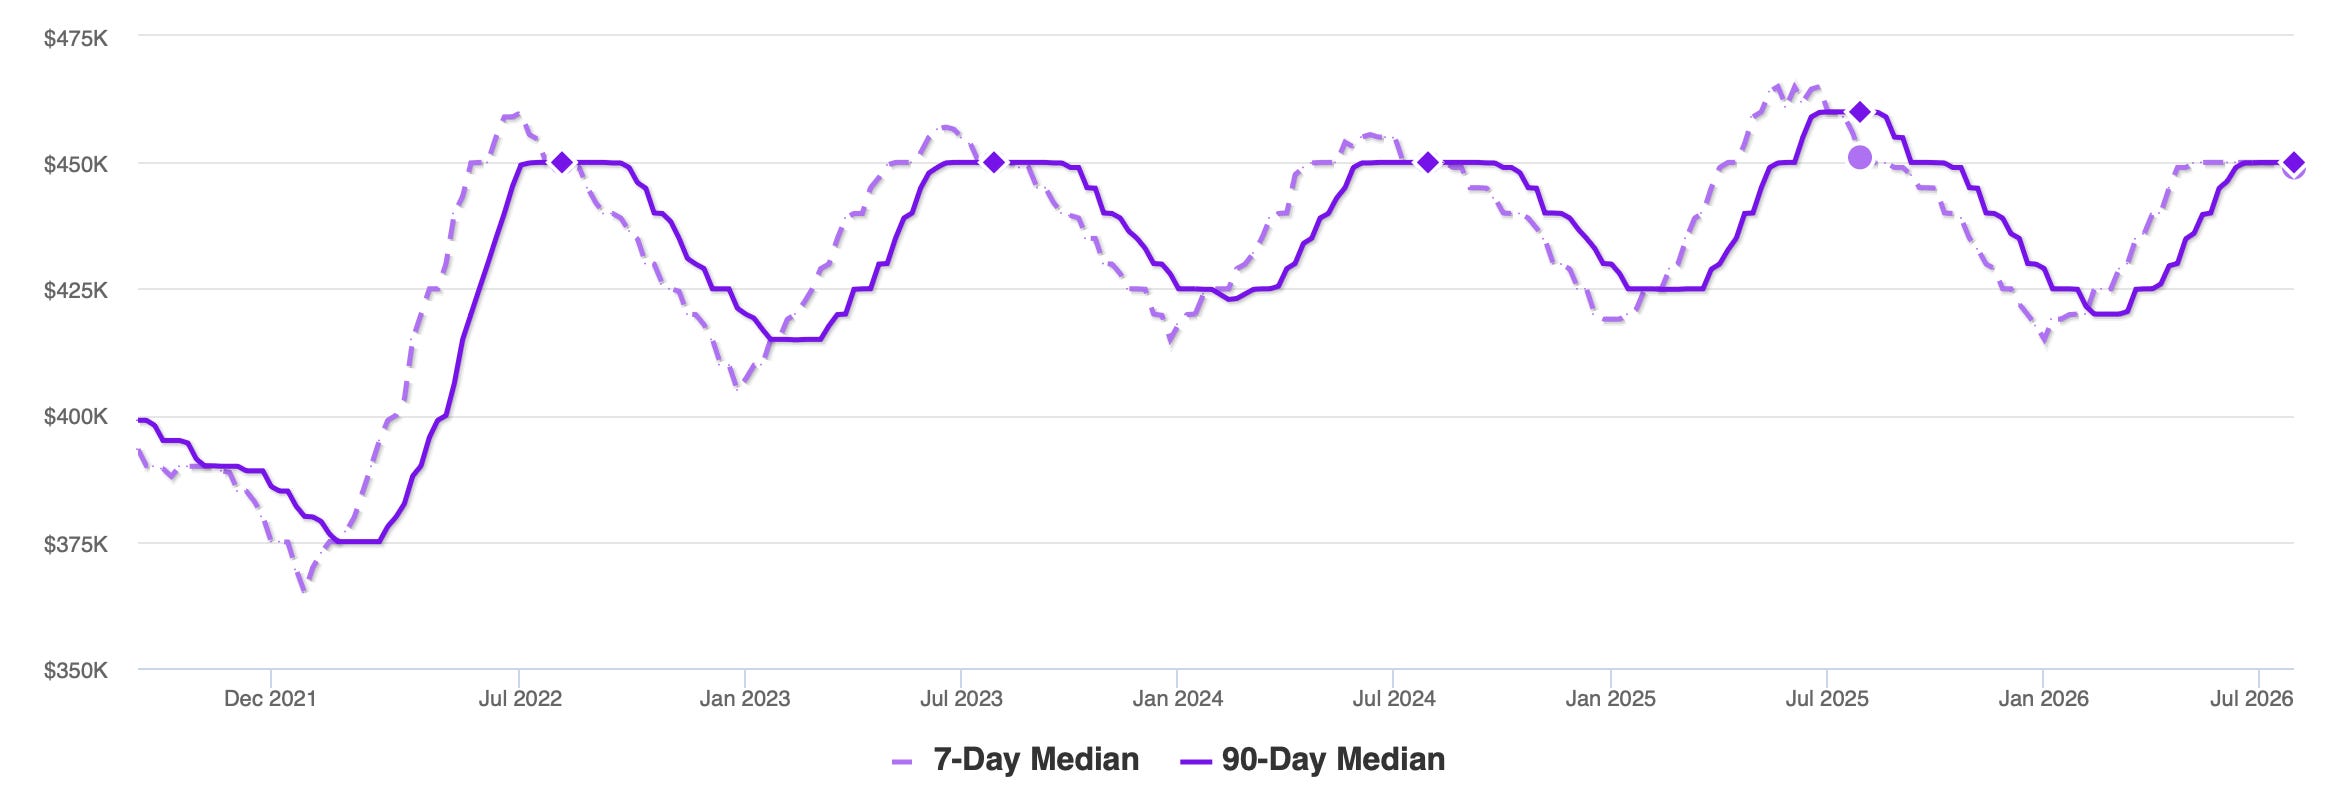
The median list price has been mostly unchanged for the last 4 years (other than the usual seasonal swings)!
Meanwhile demand is weak …
MBA: Mortgage Applications Decrease in Latest Weekly Survey
From the Mortgage Bankers Association: Mortgage Applications Decrease in Latest MBA Weekly Survey
Mortgage applications decreased 2.9 percent from one week earlier, according to data from the Mortgage Bankers Association’s (MBA) Weekly Mortgage Applications Survey for the week ending July 31, 2026.
The Market Composite Index, a measure of mortgage loan application volume, decreased 2.9 percent on a seasonally adjusted basis from one week earlier. On an unadjusted basis, the Index decreased 3 percent compared with the previous week. The Refinance Index decreased 2 percent from the previous week and was 9 percent lower than the same week one year ago. The seasonally adjusted Purchase Index decreased 4 percent from one week earlier. The unadjusted Purchase Index decreased 4 percent compared with the previous week and was 3 percent lower than the same week one year ago.
“In the wake of the July FOMC meeting, longer-term rates increased, with mortgage rates reaching their highest level in more than a year, with the 30-year fixed mortgage rate rising to 6.81 percent,” said Mike Fratantoni, MBA’s SVP and Chief Economist. “Application volume for both refinance and purchase loans declined for the week, and are now running behind last year’s pace, indicating that higher mortgage rates have weakened overall demand.” emphasis added
This graph shows the seasonally adjusted MBA mortgage purchase index. According to the MBA, purchase activity is down 3% year-over-year unadjusted.
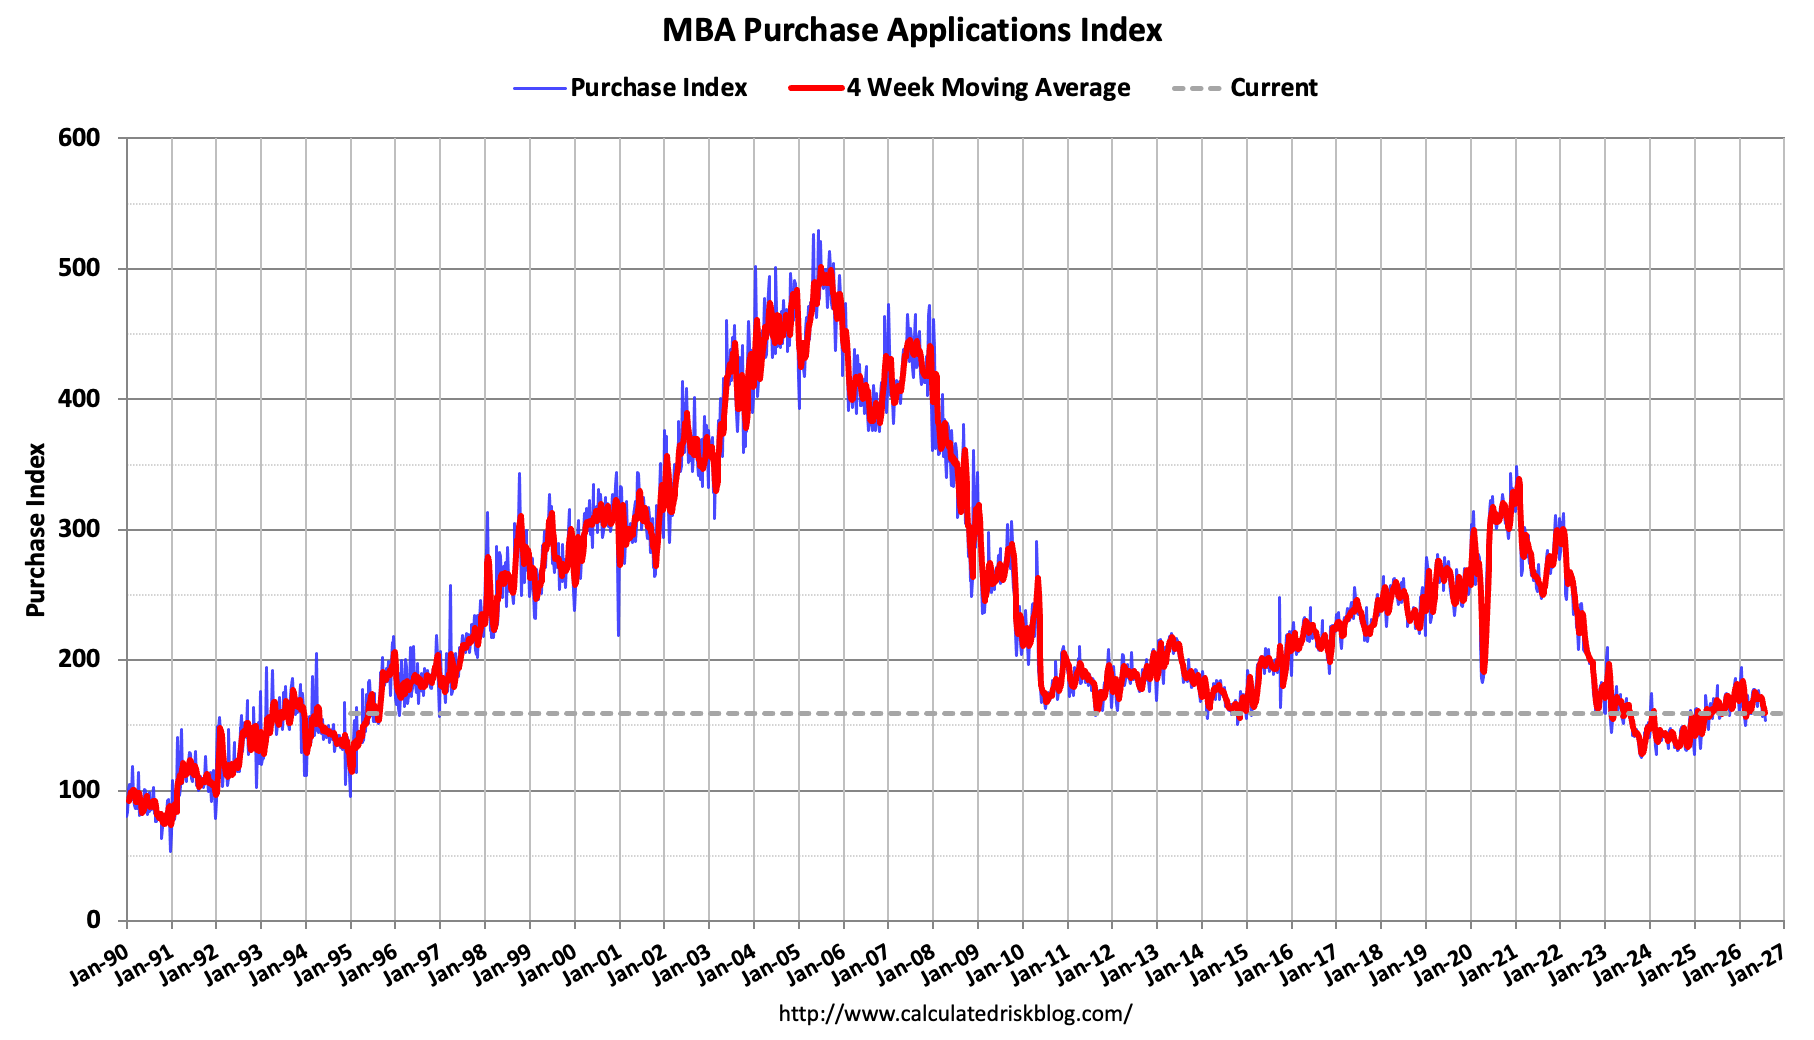
Red is a four-week average (blue is weekly). Purchase application activity remains depressed.
The second graph shows the refinance index since 1990.
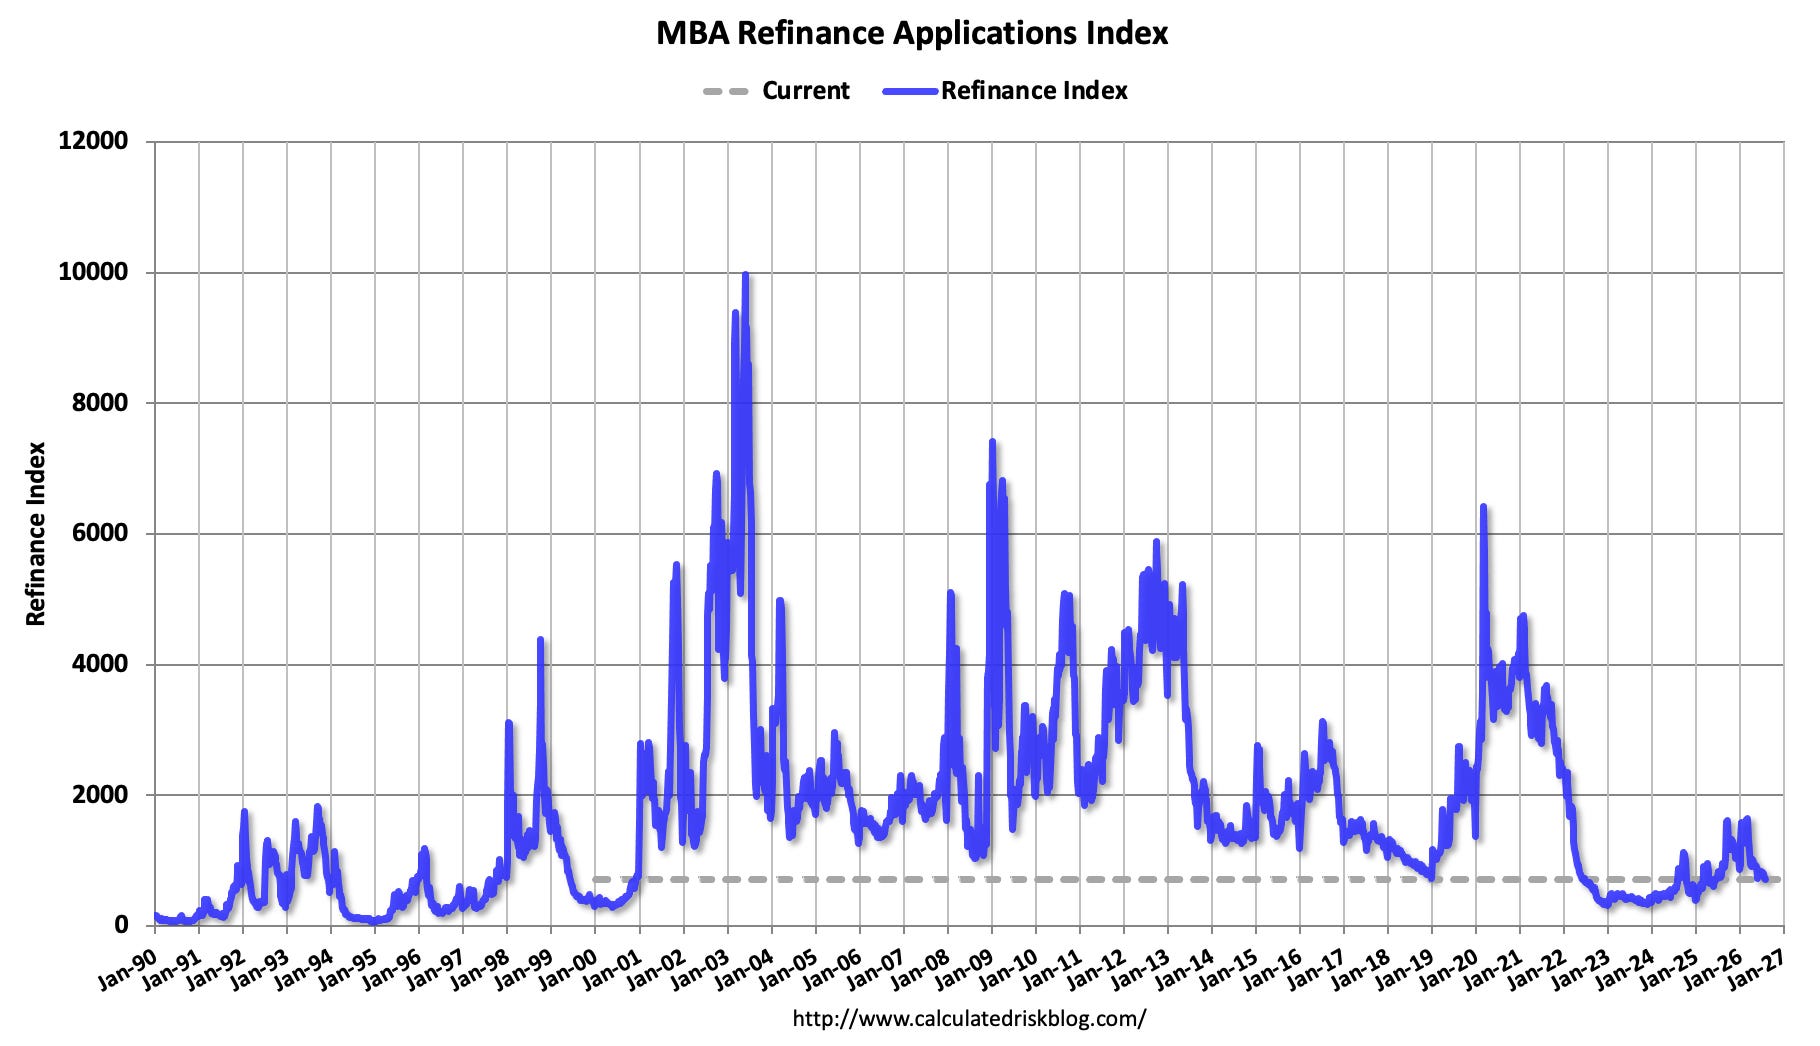
The refinance index is historically very low and has declined with the increase in mortgage rates.
Inventory growth has slowed, but demand is weak - so prices have increased slightly year-over-year.