Some More Good News for Homebuilders
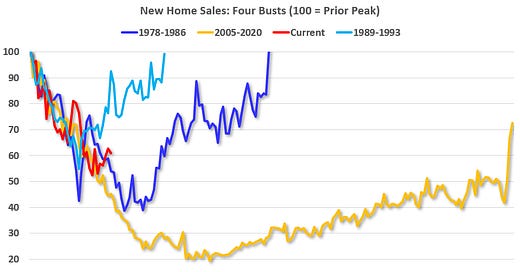
Every housing cycle is different; however, I’ve been arguing that this cycle wouldn’t be anything like the new home market that followed the housing bust, and that this recovery would be more similar to other previous cycles.
Here is an updated graph from the previous posts showing new home sales from the Census Bureau for four periods: 1978-1982, 1989 -1993, 2005-2020, and current (red). The prior peak in sales is set to 100 (updated through the April New Home sales release).
Also, it is likely that the Census Bureau is underestimating sales now since cancellation rates are falling! See: New Home Sales and Cancellations for a discussion on how cancellations impact the Census’ sales numbers.
Keep reading with a 7-day free trial
Subscribe to CalculatedRisk Newsletter to keep reading this post and get 7 days of free access to the full post archives.


