Discover more from CalculatedRisk Newsletter
'Some prospective buyers took a break'
Existing Home Sales forecast, and adding Boston, Indiana, Rhode Island, and Washington D.C. September Data
Lawler: Early Read on Existing Home Sales in September
Housing economist Tom Lawler has been sending me his predictions of what the NAR will report for over 11 years. Lawler hasn't always been closer than the consensus, but usually when there has been a fairly large spread between Lawler's estimate and the "consensus", Lawler has been closer.
This month - take the over!
From housing economist Tom Lawler:
Based on publicly-available local realtor/MLS reports released across the country through today, I project that existing home sales as estimated by the National Association of Realtors ran at a seasonally adjusted annual rate of 6.2 million in September, up 5.4% from August’s preliminary pace but down 3.7% from last September’s seasonally adjusted pace
Local realtor reports, as well as reports from national inventory trackers, suggest that the YOY % decline in the inventory of existing homes for sale last month was similar to that in August.
Finally, local realtor/MLS reports suggest the median existing single-family home sales price last month was up by about 12.6% from last September.
CR Note: The National Association of Realtors (NAR) is scheduled to release September existing home sales on Thursday, October 21, 2021 at 10:00 AM ET. The consensus is for 6.06 million SAAR. Last year, in Sept 2020, the NAR reported sales of 6.44 million SAAR.
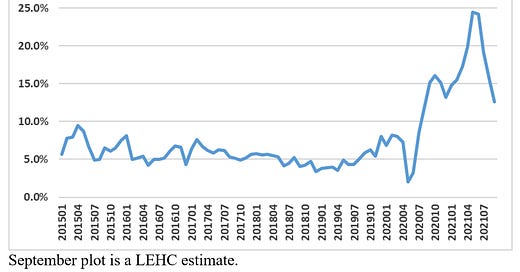
Also, note that the NAR reported median prices were up 23.6% Year-over-year (YoY) in May, 23.4% in June, 17.8% in July and 14.9% in August. Lawler estimates the NAR will report YoY growth slowed to 12.6% in September.
Please share with your friends and colleagues!
Local Market Updates
I’m tracking about 30 local housing markets in the US. Some of the 30 markets are states, and some are metropolitan areas. I update these tables throughout the month as additional data is released.
The following data is important, especially active inventory and new listings. One of the key factors for house prices is supply, and tracking local inventory reports will help us understand what is happening with supply.
Also note the divergence between markets (last year all markets mostly moved together).
Some Local Press Releases “Some prospective buyers took a break”
From the Greater Boston Association of REALTORS® (GBAR) (pdf)
After nearly 12 months of soaring sales and record-high selling prices, the residential real estate market in Greater Boston appears to be softening, at least temporarily. Sales of single-family homes declined on an annual basis for a second consecutive month in September, while median selling prices of single-family homes and condominiums slipped or remained flat for a third straight month, a report from the Greater Boston Association of REALTORS® (GBAR) found. The cooldown follows a sharp increase in new listings last month and at a time when mortgage rates are inching upward.
From the Greater Capital Area Association of REALTORS® (pdf)
The September information is the latest from the Greater Capital Area Association of REALTORS® (GCAAR), representing sales data for the Washington, D.C. and Montgomery County markets. Closed sales for the region totaled 1,945, representing a 15.1% decrease in closed sales when compared to September 2020.
From the Rhode Island Association of Realtors®
“The single-family home market has been incredibly competitive and the properties that are available for sale are put under contract so quickly, that it appears some prospective buyers took a break. Also, the spread of the delta variant affected the market last quarter, keeping some buyers at home and making some prospective sellers think twice about listing their home,” said Leann D’Ettore, President of the Rhode Island Association of Realtors. emphasis added
Active Inventory in September
Here is a summary of active listings for these housing markets in September. For these markets, inventory was up 0.6% in September MoM from August, and down 22.6% YoY.
Inventory in San Diego is at an all time low, whereas inventory in Denver and Sacramento is up more than double from the all time low earlier this year.
Austin, Sacramento and Washington, D.C. are three of the areas with inventory up YoY. The C.A.R. recently reported that inventory in 40% of the markets in California are either unchanged or up year-over-year. This is a change.
Notes for all tables:
New additions to table in BOLD.
Northwest (Seattle), North Texas (Dallas), and Santa Clara (San Jose)
Totals do not include Atlanta or Denver (included in state totals).
New Listings in September
And here is a table for new listings in September. For these areas, new listings were down 1.1% YoY.
Note: Not all areas report new listings.
Closed Sales in September
And a table of September sales. Sales for these markets were down 3.7% YoY, Not Seasonally Adjusted (NSA). This does not include California with sales down 10.5% YoY SA.
Please subscribe for housing data and analysis.