
The "Home ATM" Closed in Q4
Mortgage Equity Withdrawal (MEW) was low in Q4

During the housing bubble, many homeowners borrowed heavily against their perceived home equity - jokingly calling it the “Home ATM” - and this contributed to the subsequent housing bust, since so many homeowners had negative equity in their homes when house prices declined. Note: Very few homeowners have negative equity now - unlike during the housing bubble.
Refinance activity declined significantly in early 2022 as mortgage rates increased, and I was expecting MEW to also decline as fewer homeowners used cash-out refinancing. However, in mid-2022, homeowners switched to using home equity loans (2nd loans) to extract equity from their homes.
The Fed noted this increase in demand for HELOCs in the October 2022 Senior Loan Officer Opinion Survey on Bank Lending Practices: “banks reported tighter standards and stronger demand for home equity lines of credit (HELOCs).” However, in the last five surveys, in January 2023, April 2023, July 2023, October 2023, and January 2024, the Fed noted that “banks reported tighter standards and weaker demand for home equity lines of credit (HELOCs).” emphasis added
Since demand weakened last year for HELOCs, and refinancing activity is off sharply, MEW turned negative in Q1 and was only slightly positive in Q2 through Q4 2023, Mortgage Equity Withdrawal is an aggregate number and is a combination of homeowners extracting equity - hence the name "MEW" - and normal principal payments and debt cancellation (modifications, short sales, and foreclosures).
There are few debt cancellations now, so little MEW suggests that normal principal payments offset equity borrowing in Q4.
Quarterly Increase in Mortgage Debt
Here is the quarterly increase in mortgage debt from the Federal Reserve’s Financial Accounts of the United States - Z.1 (sometimes called the Flow of Funds report) released today. In the mid ‘00s, there was a large increase in mortgage debt associated with the housing bubble.
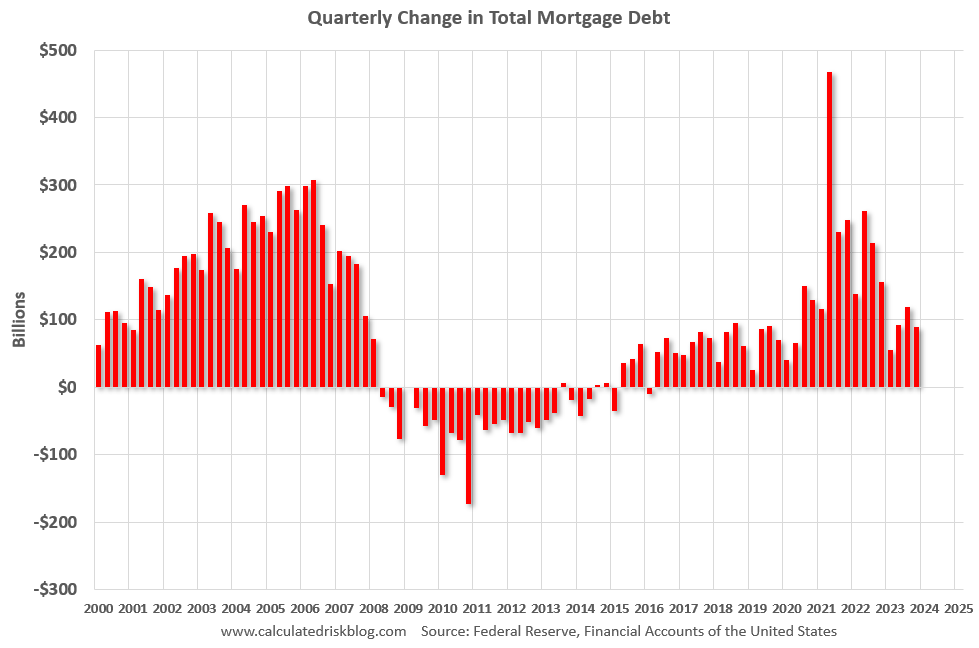
In Q4 2024, mortgage debt increased $90 billion, down from $119 billion in Q3, and down from the cycle peak of $467 billion in Q2 2021. Note the almost 7 years of declining mortgage debt as distressed sales (foreclosures and short sales) wiped out a significant amount of debt.
However, some of this debt is being used to increase the housing stock (purchase new homes), so this isn’t all Mortgage Equity Withdrawal (MEW).
Mortgage Debt as a Percent of GDP
The second graph shows household real estate assets and mortgage debt as a percent of GDP. Note this graph was impacted by the sharp decline in Q2 2020 GDP.

Mortgage debt is up $2.36 trillion from the peak during the housing bubble, but, as a percent of GDP is at 46.78% - down from Q3 - and down from a peak of 73.3% of GDP during the housing bust. This means most homeowners have large equity cushions in their home.
The value of real estate, as a percent of GDP, decreased in Q4 - and is below the peak in Q3 2022 - but is well above the average of the last 30 years.
Calculated Risk Estimate of MEW
Keep reading with a 7-day free trial
Subscribe to CalculatedRisk Newsletter to keep reading this post and get 7 days of free access to the full post archives.