
The "Home ATM" Mostly Closed in Q4
Total Mortgage Equity Withdrawal (MEW) was Slightly Positive in Q4

During the housing bubble, many homeowners borrowed heavily against their perceived home equity - jokingly calling it the “Home ATM” - and this contributed to the subsequent housing bust, since so many homeowners had negative equity in their homes when house prices declined.
Unlike during the housing bubble, very few homeowners have negative equity now. From CoreLogic last week: CoreLogic: Borrowers Gained Over $280B in Home Equity in 2024
Quarter-over-quarter, the total number of mortgage residential properties with negative equity increased by 9.3% to 1.1 million homes or 2% of all mortgaged properties. While year-over-year, negative equity increased by 7% from 1 million homes, or 1.8% of all mortgage properties … Negative equity peaked at 26% of mortgaged residential properties in Q4 2009 based on CoreLogic equity data analysis. emphasis added
Mortgage Equity Withdrawal is an aggregate number and is a combination of homeowners extracting equity - hence the name "MEW" - and normal principal payments and debt cancellation (modifications, short sales, and foreclosures).
Quarterly Increase in Mortgage Debt
Here is the quarterly increase in mortgage debt from the Federal Reserve’s Financial Accounts of the United States - Z.1 (sometimes called the Flow of Funds report) released today. In the mid ‘00s, there was a large increase in mortgage debt associated with the housing bubble.
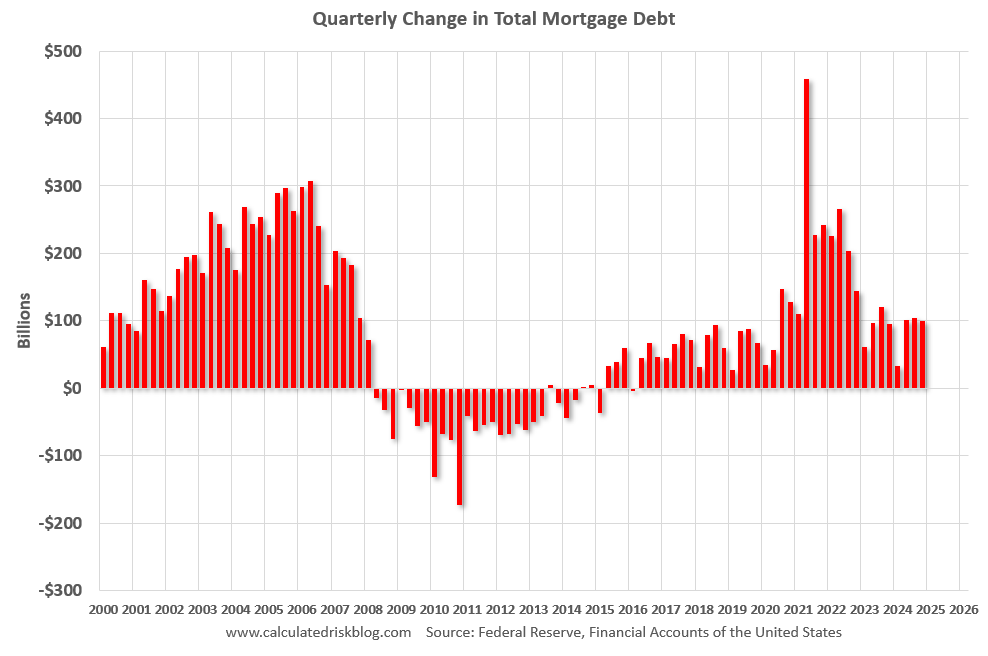
In Q4 2024, mortgage debt increased $100 billion, down from $105 billion in Q3, and down from the cycle peak of $459 billion in Q2 2021. Note the almost 7 years of declining mortgage debt as distressed sales (foreclosures and short sales) wiped out a significant amount of debt.
However, some of this debt is being used to increase the housing stock (purchase new homes), so this isn’t all Mortgage Equity Withdrawal (MEW).
Mortgage Debt as a Percent of GDP
The second graph shows household real estate assets and mortgage debt as a percent of GDP. Note this graph was impacted by the sharp decline in Q2 2020 GDP.
Mortgage debt is up $2.57 trillion from the peak during the housing bubble, but, as a percent of GDP is at 44.9% - down from Q3 - and down from a peak of 73.1% of GDP during the housing bust. This means most homeowners have large equity cushions in their home.

The value of real estate, as a percent of GDP, decreased in Q4 and is below the peak in Q2 2022, but is well above the median of the last 30 years.
Calculated Risk Estimate of MEW
The following content is for paid subscribers only. Thanks to all paid subscribers!
Keep reading with a 7-day free trial
Subscribe to CalculatedRisk Newsletter to keep reading this post and get 7 days of free access to the full post archives.