


1st Look at Local Housing Markets in June

Tracking local data gives an early look at what happened the previous month and also reveals regional differences in both sales and inventory.
Closed sales in June were mostly for contracts signed in April and May, and mortgage rates, according to the Freddie Mac PMMS, averaged 6.73% in April and 6.82% in May (slightly higher than for closed sales in May).
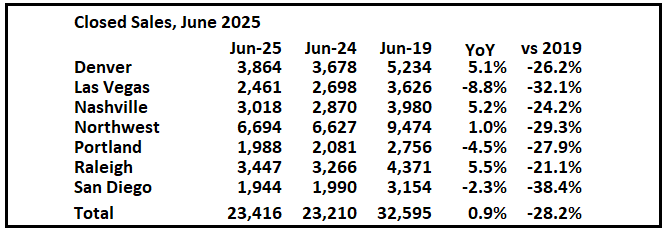
Closed Sales in June
In June, sales in these early reporting markets were up 0.9% YoY. Last month, in May, these same markets were down 5.7% year-over-year Not Seasonally Adjusted (NSA).
Important: There were more working days in June 2025 (20) as in June 2024 (19). So, the year-over-year change in the headline SA data will be lower than for the NSA data.
Notes for all tables:
New additions to table in BOLD.
For the previous month (May), there were fewer working days in May 2025 (21) as in May 2024 (22). So, the year-over-year change in the headline SA data was higher than for the NSA data. So, the NAR reported year-over-year change in the headline SA data (-0.7%) were higher than the change in the NSA data (-4.0%) although there are other seasonal factors.
Sales in all of these markets are down sharply compared to June 2019.
This graph shows existing home sales by month for 2024 and 2025, on a Seasonally Adjusted Annual Rate (SAAR) basis. Last year, the NAR reported sales in June 2024 were at 3.93 million SAAR.
The next four months - June through September - will be the easiest year-over-year comparisons.

This early data suggests that the June existing sales (as reported by the NAR) might be lower than sales in May (SA) but might show a year-over-year increase following four consecutive months with a YoY decrease.
Total sales last year (2024) were the lowest since 1995 (lower than any year during the housing bust), so it says something that sales are tracking even lower in 2025!
New Listings in June
For these areas, new listings were up 7.7% year-over-year.
Last month, new listings in these markets were up 9.8% year-over-year.
New listings are now up year-over-year, but down 16.4% compared to June 2019 activity.

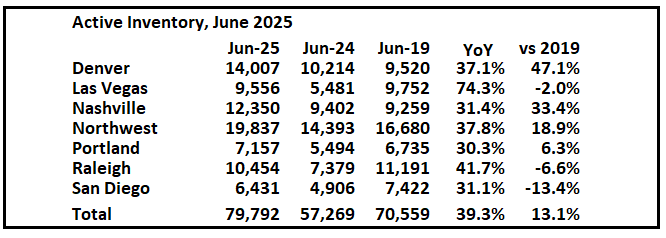
Active Inventory in June
Inventory was up 39.3% year-over-year. Last month inventory in these markets was up 45.2% YoY. Inventory is picking up more than usual in the Spring.
Comparing to June 2019, inventory is up sharply in Denver and Nashville and down in Raliegh and San Diego. There are significant regional differences in inventory.
This was just several early reporting markets. Many more local markets to come!